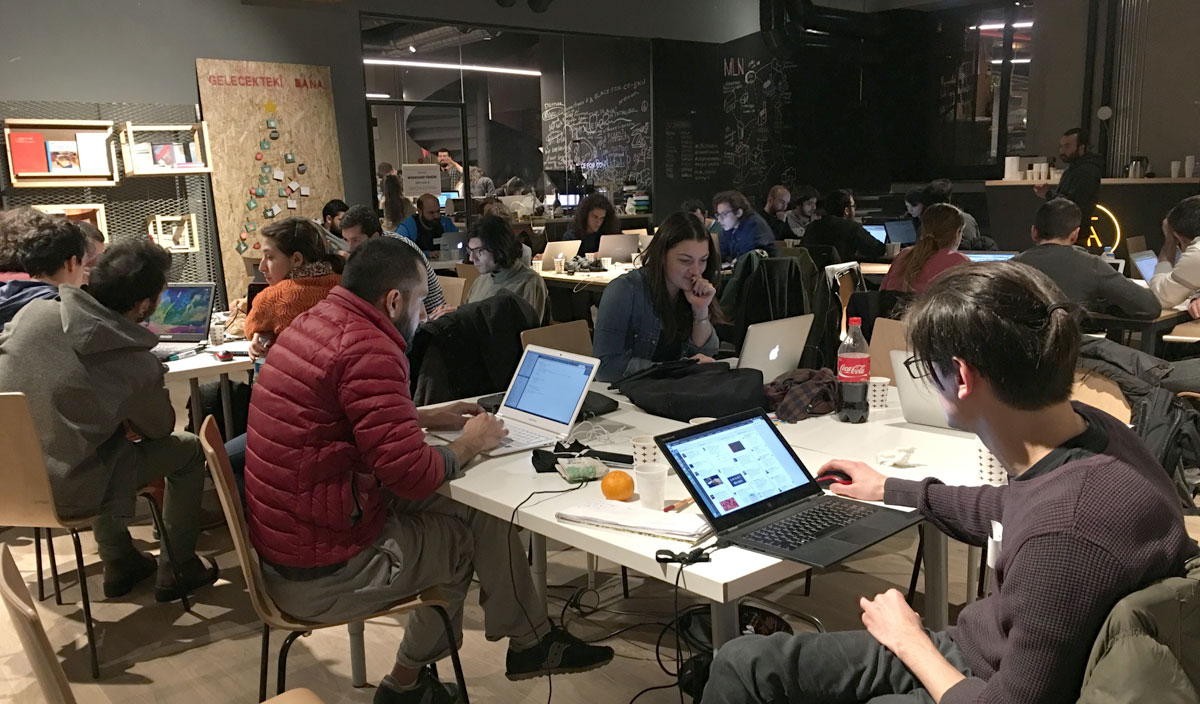
We organized a two-day hackathon “Creative Use of Complex Networks” hosted by ATOLYE Istanbul on Jan 9-10, 2016. Participants created semantic network models, built graph databases, and developed graph-driven applications to map and analyze complex issues in civil society. We think civil society would benefit from having their own methods and tools to collectively imagine and author new protocols and create new interfaces that would compose large-scale civic networks and data streams. Below is selected work from the hackathon with short explanations, links to interactive maps, code repositories, data sources, screenshots, and photos.
Graph Commons is a collaborative network mapping platform and a knowledge base of relationships. With Graph Commons you transform your data into interactive network maps and connect partial information to explore complex relations that impact you and your communities.
Click on the images and titles to view the interactive graphs.
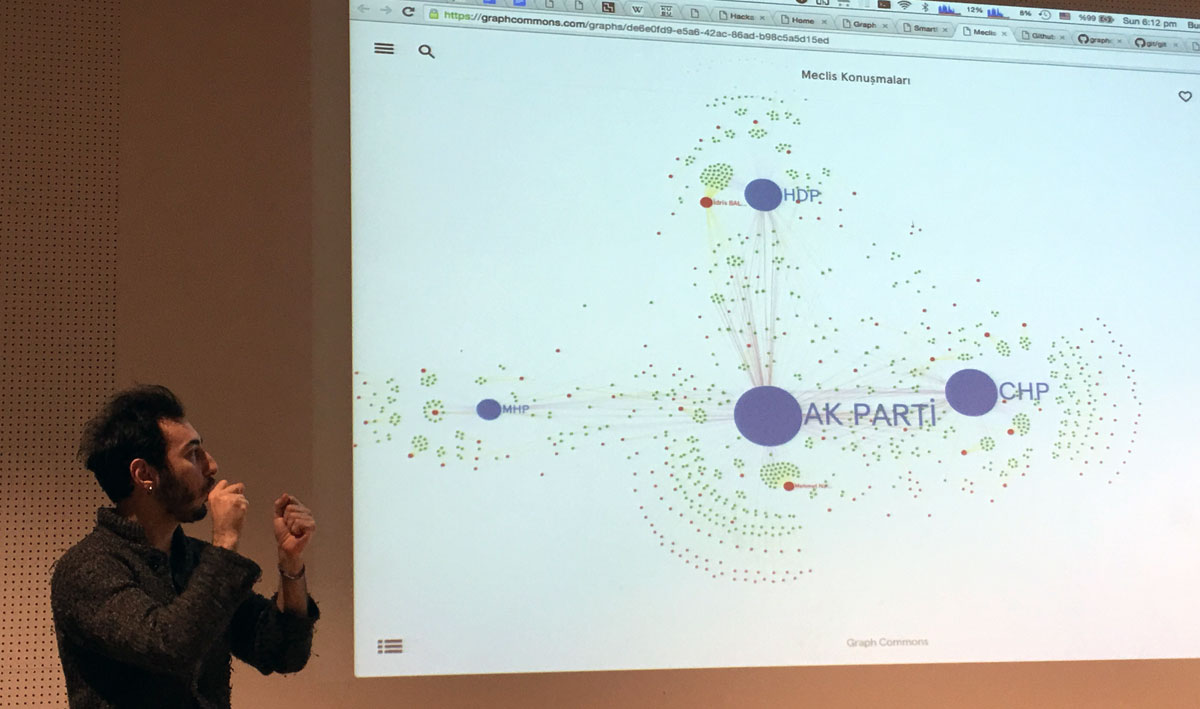
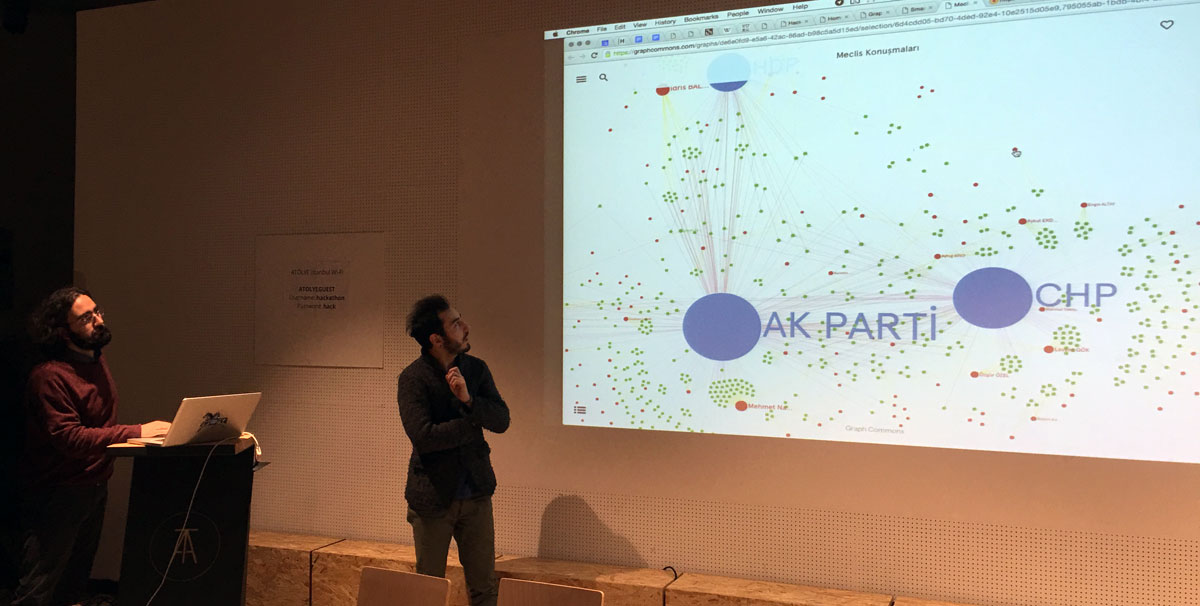
Turkey’s Parliamentary Minutes Graph
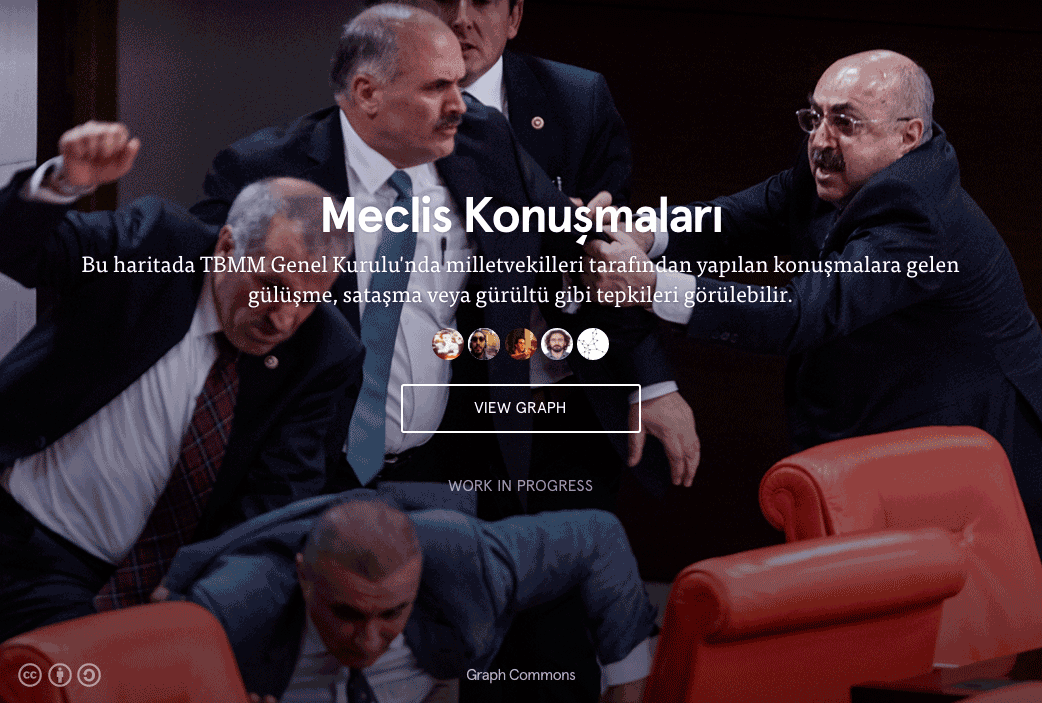
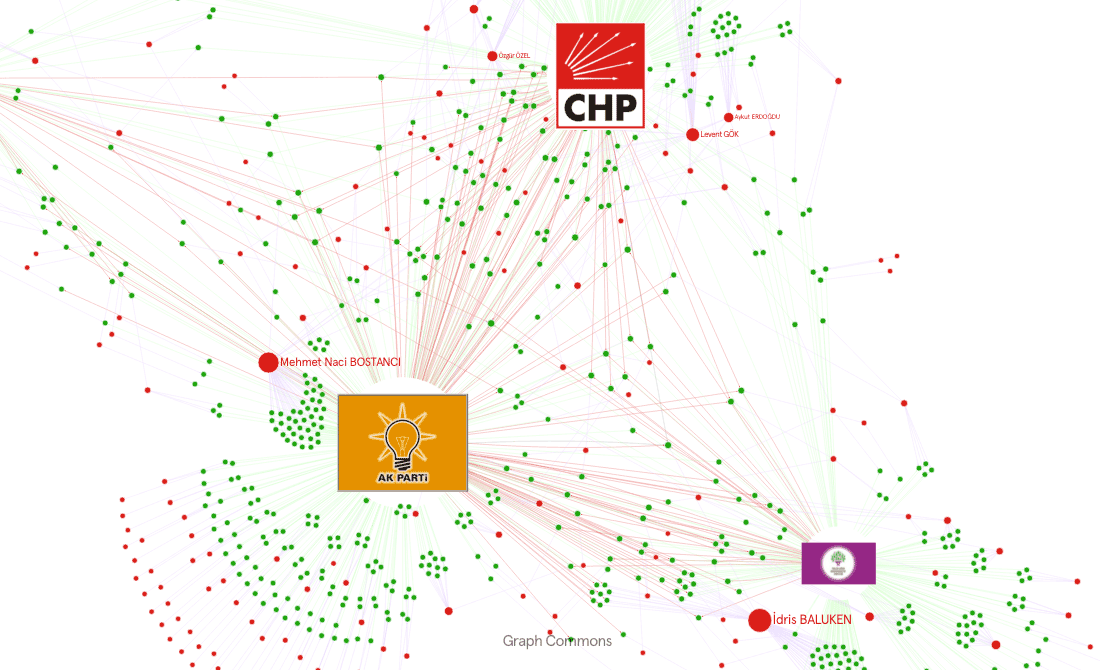
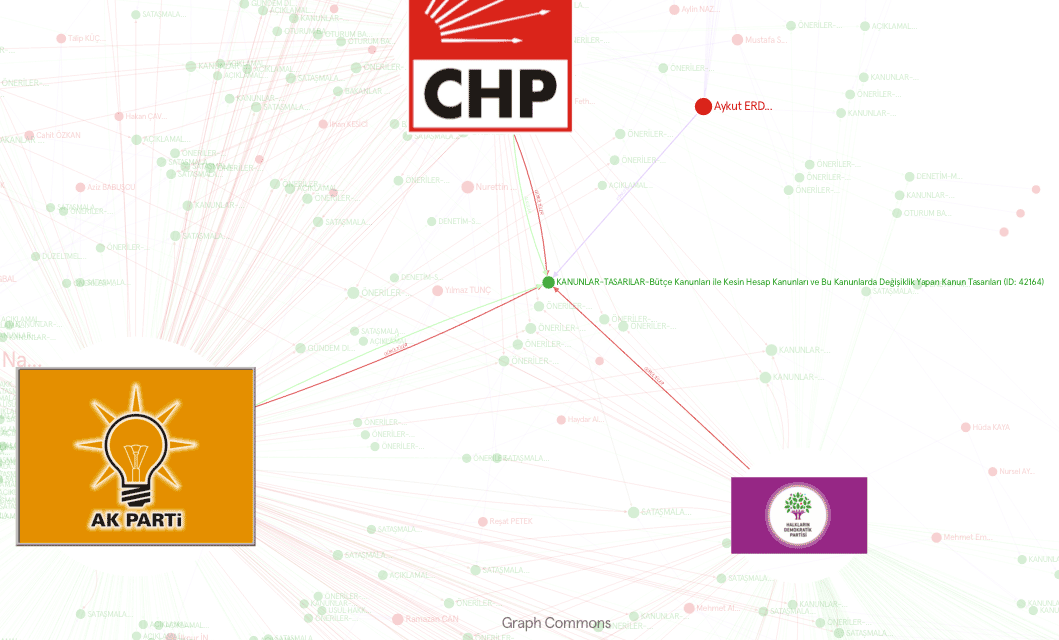
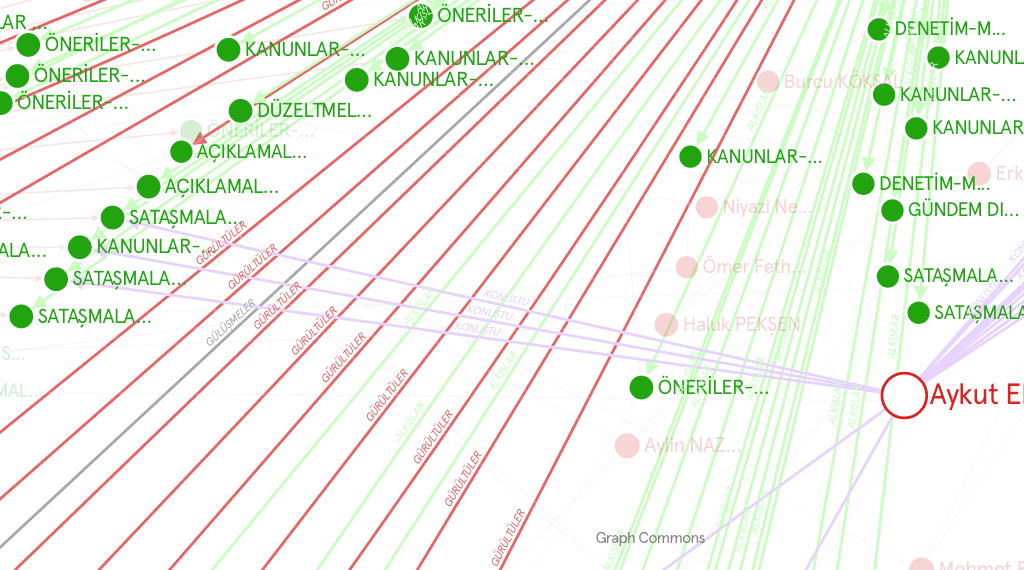
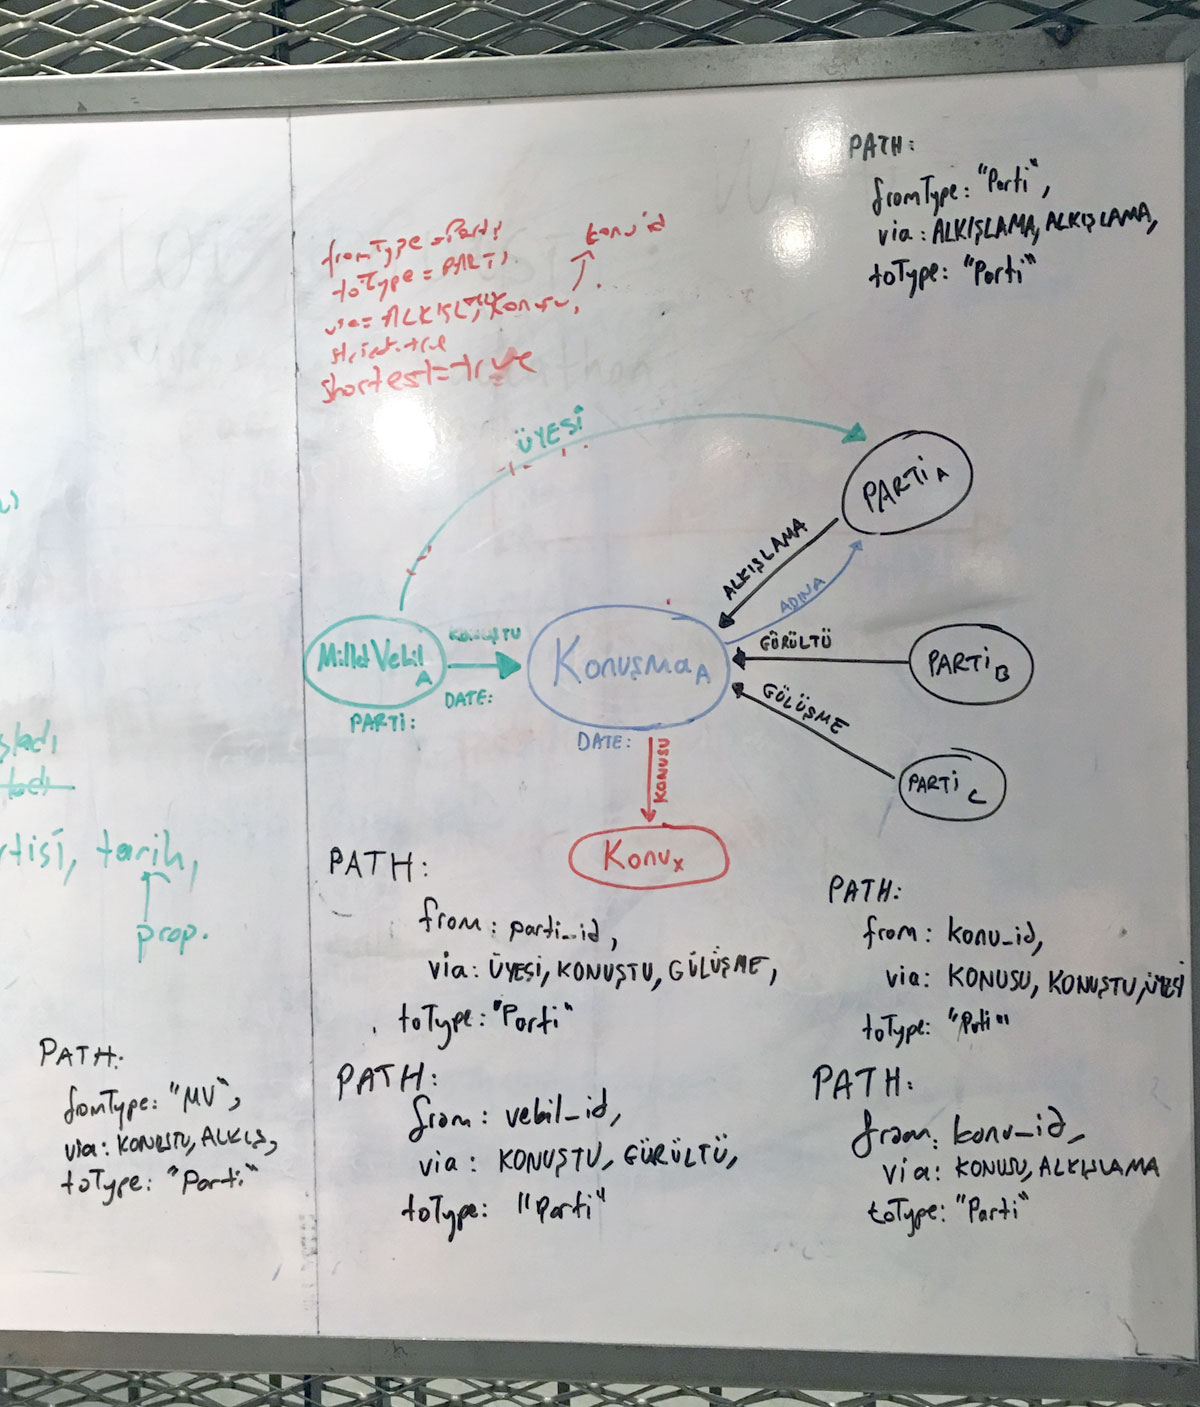
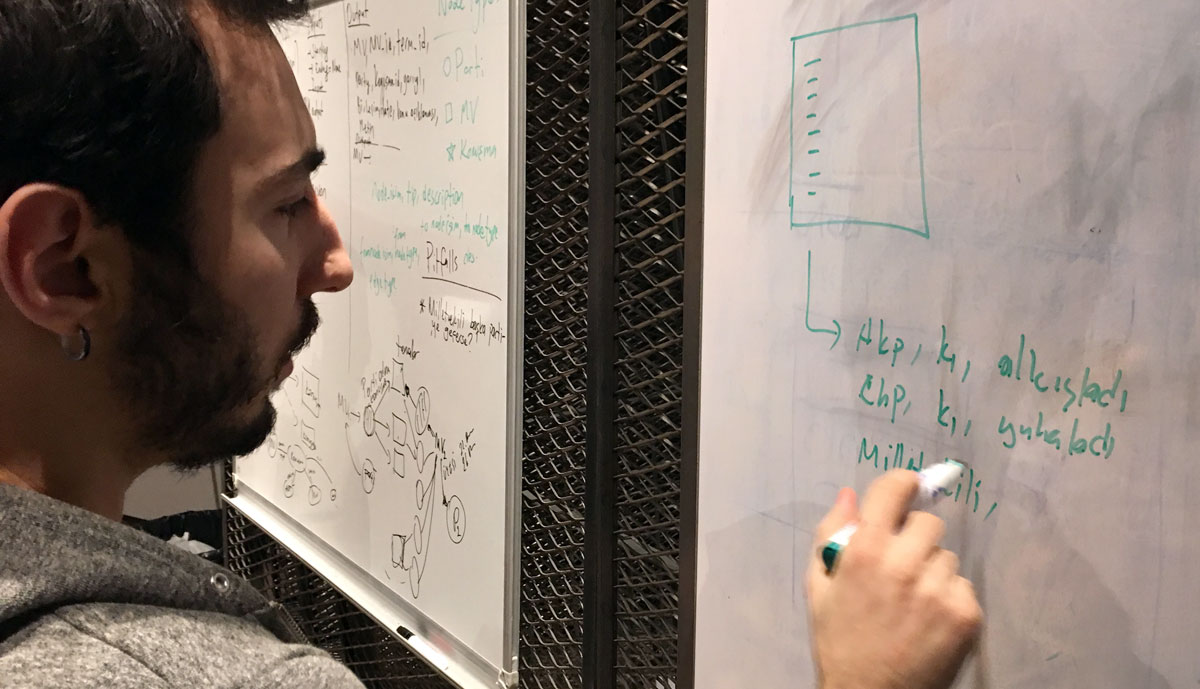
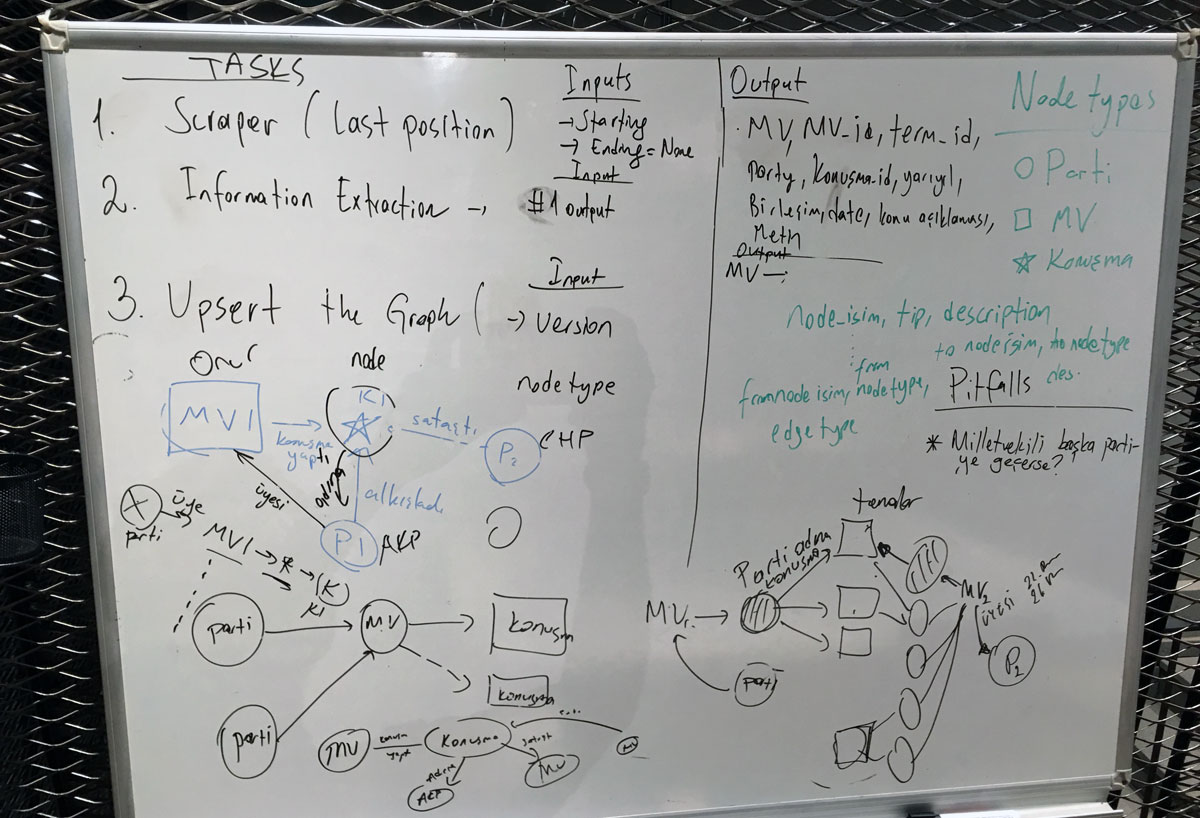
Parliamentary Minutes Graph maps the reactions of political parties to the MP speeches in Turkey’s parliament (TBMM). The full speech is typed by official parliament reporters and published on the TBMM website daily. The minute text includes reactions such as laughter, bullying, applause, and protests from various parties to the speaking MP. In the graph, the green nodes represent the speech, the red nodes are MPs, and the blue nodes are political parties. You can start exploring the graph by clicking on a speech node that is at the center, which means it got many negative or positive reactions. Enjoy this first-of-its-kind behavioral analysis of a parliament.
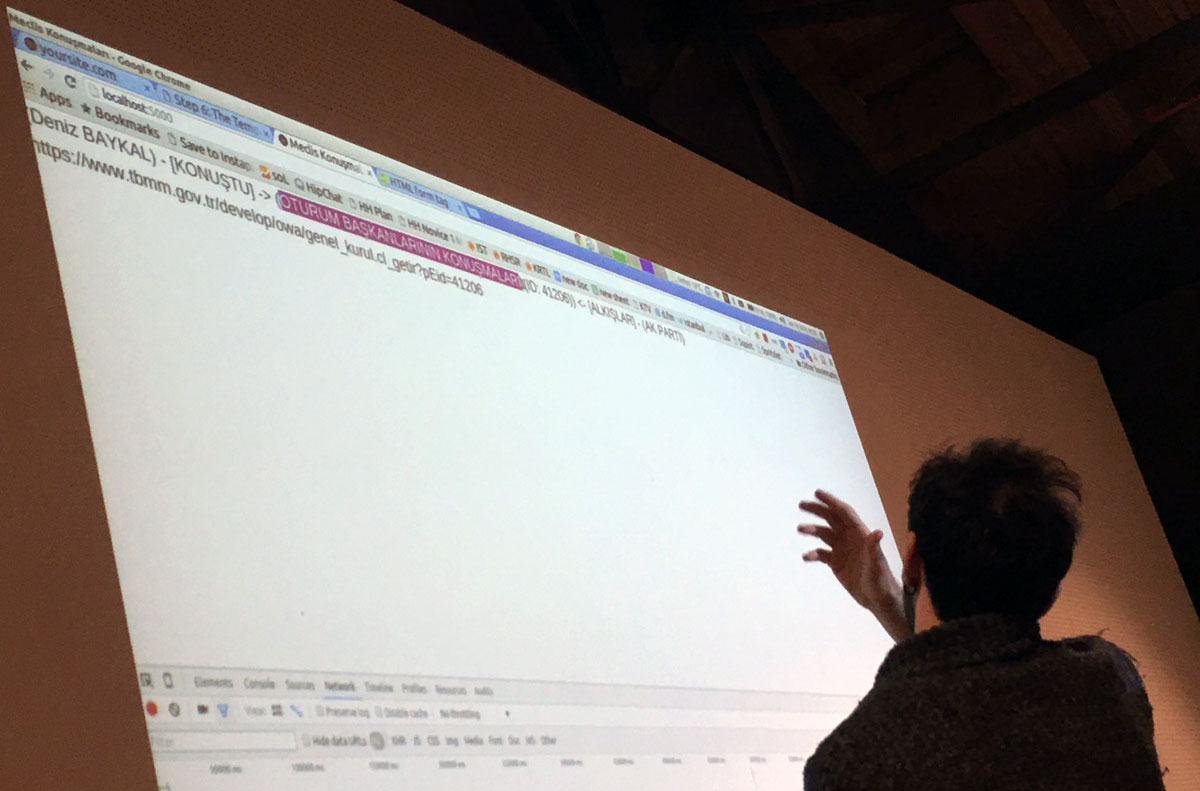
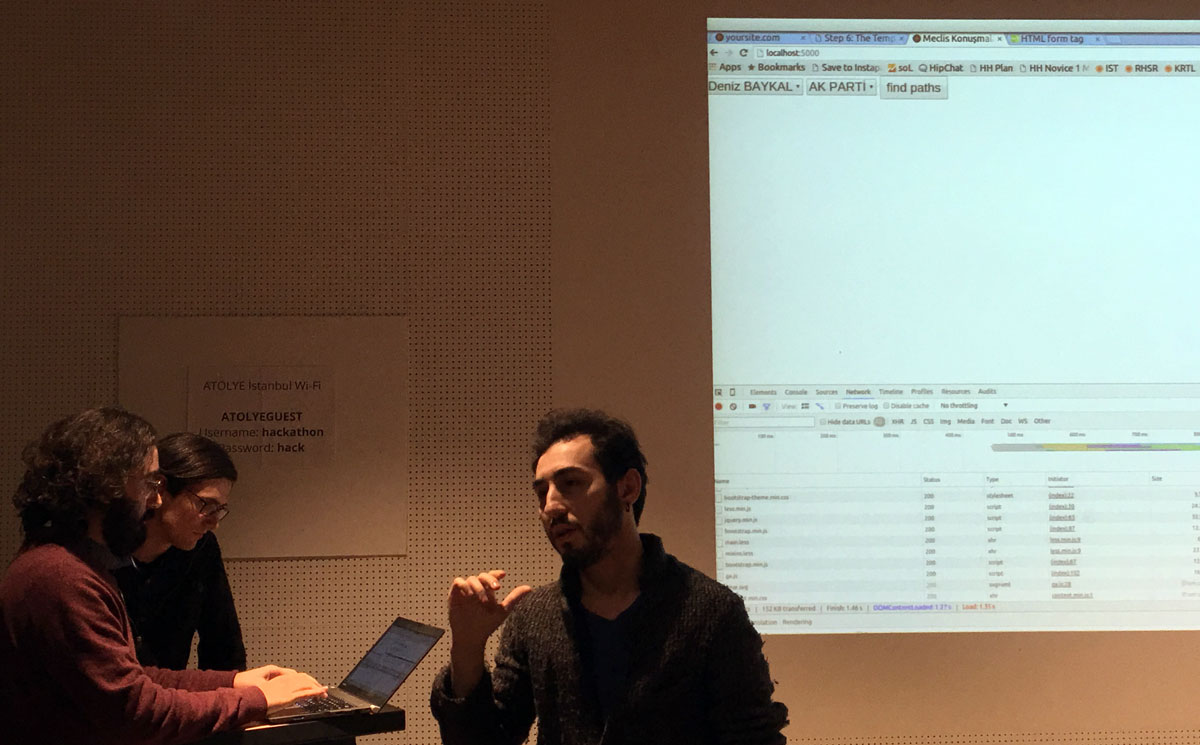
The graph is generated (and being updated) by a TBMM-to-graph application called “Parliamentary Minutes” developed by Doruk Tunaoğlu, Fevzi Kahraman, Onur Güngör, and Osman Başkaya. It has modules for data crawling, information extraction, and graph creation. The group also developed a path searching interface, where you can look up an MP and a party and see if there are any reaction paths exist between them. This application, along with last hackathon’s TBMM scraper aka “bureaucracy graph generator”, provides a graph-structured activity stream of Turkey’s parliament. Also see Turkey’s political chronology database compiled by Fatih Erikli.
- Data source: http://tbmm.gov.tr
- Code repository: https://github.com/graphs-for-society/parliamentary-minutes
- Graph generator: Python wrapper for Graph Commons API
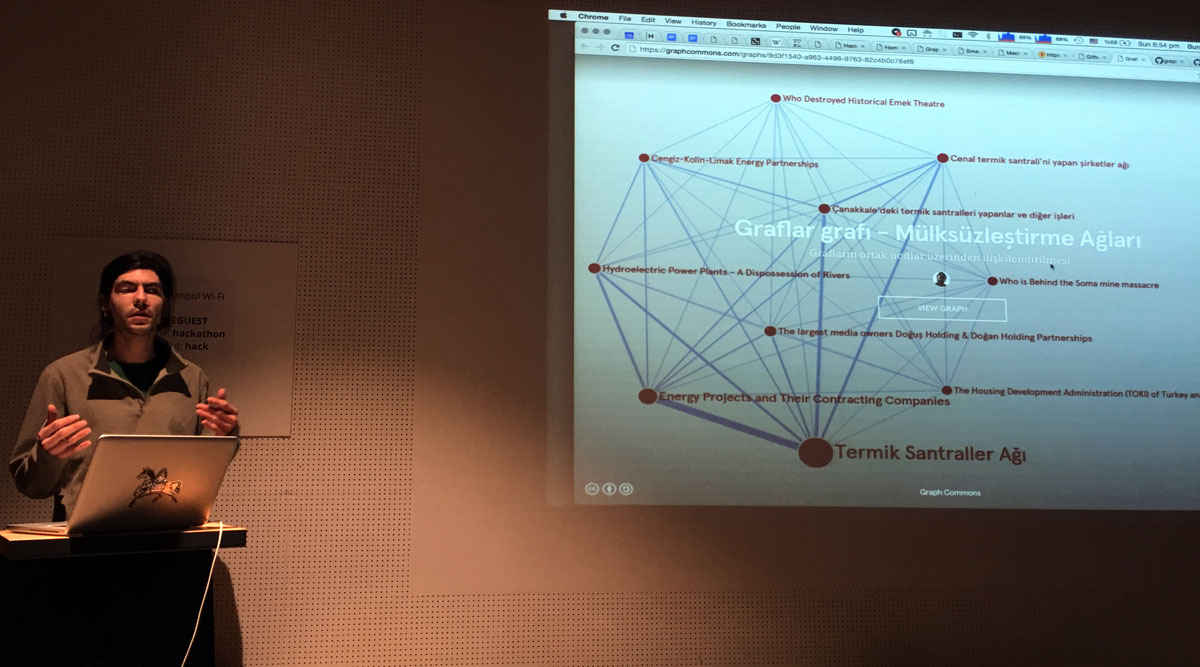
Metagraph
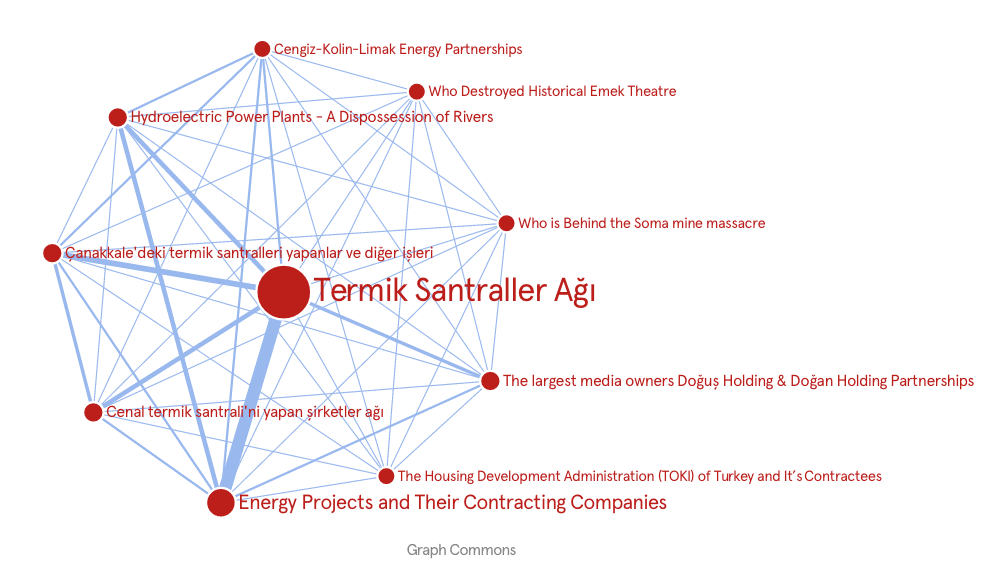
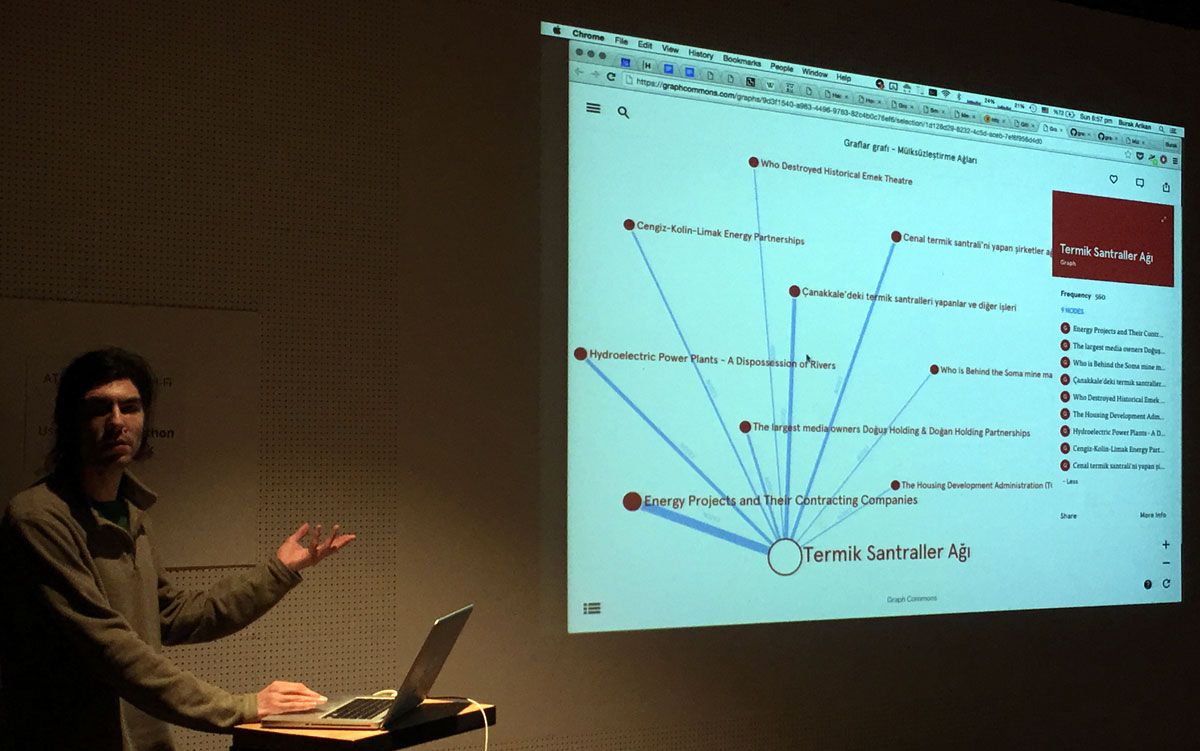
Metagraph, created by Yakup Cetinkaya, is a graph of similar graphs in the Networks of Dispossession hub, which contains 22 public graphs. It interconnects graphs based on the number of shared nodes, which are represented as connection weights. You can clearly see the graphs focused on energy are closely connected to each other. This work is a great reflection of how Graph Commons hubs work. You build a networked knowledge base by importing, adding, and collectively editing data over time. The knowledge base itself is a giant graph, not visual and not telling a story, it is rather a data world that you build. Using the hub explore feature, you explore actors and relations you’re interested, and generate particular graphs which frame a different aspect of the database, hence tell a particular digestible story from the whole.
This graph is generated by the Metagraph application which collects graph data and generates meta-graphs via the Graph Commons API.
- Data source: Graph Commons API
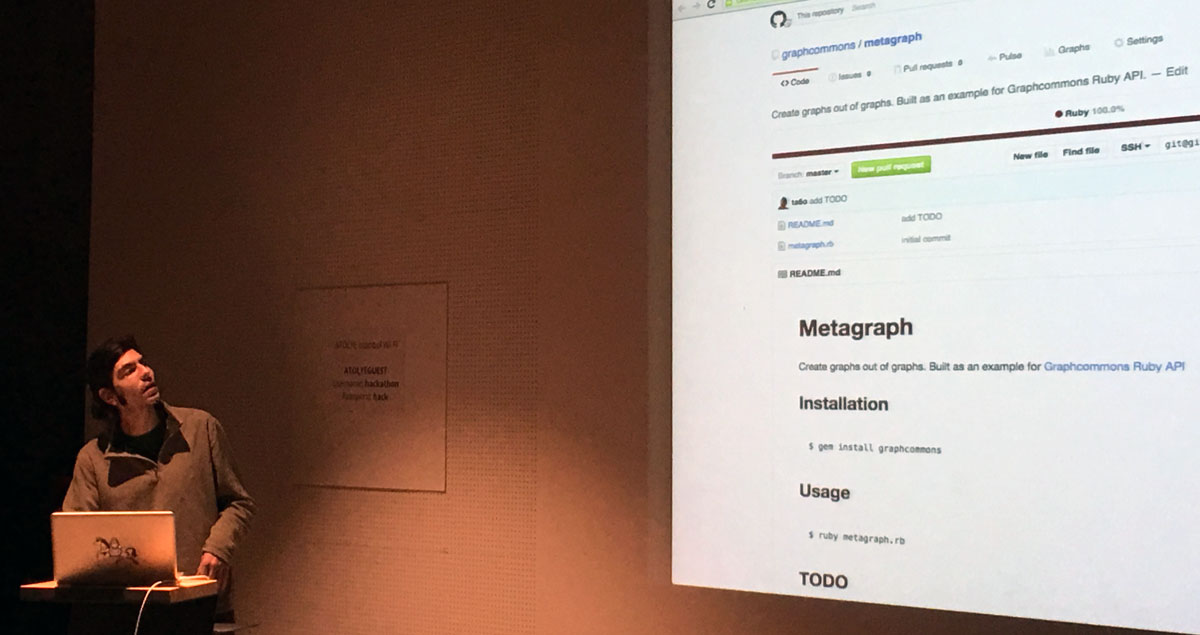
- Code repository: https://github.com/ta6o/metagraph
- Graph generator: Ruby Wrapper for Graph Commons API
Githubbers: Mapping Github repository networks
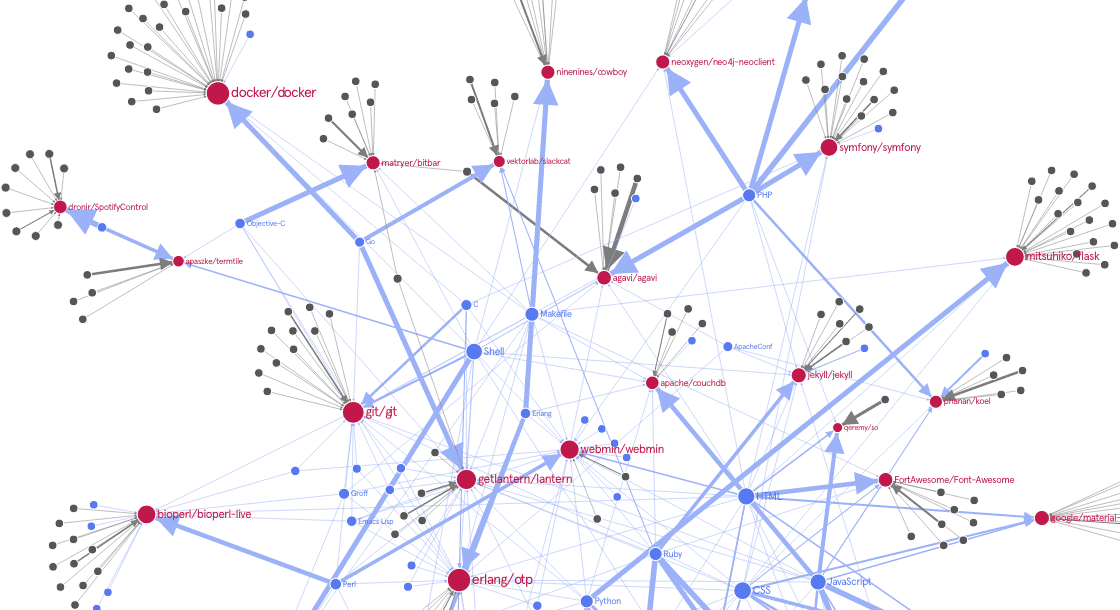
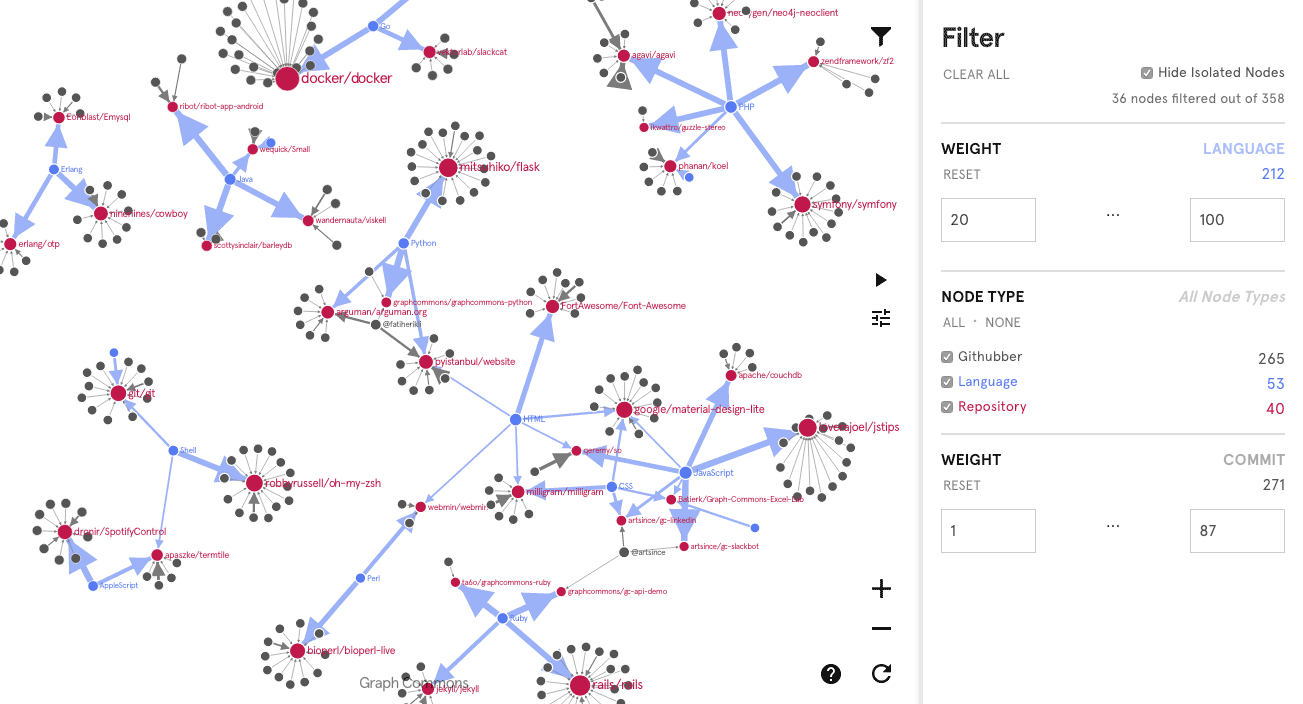
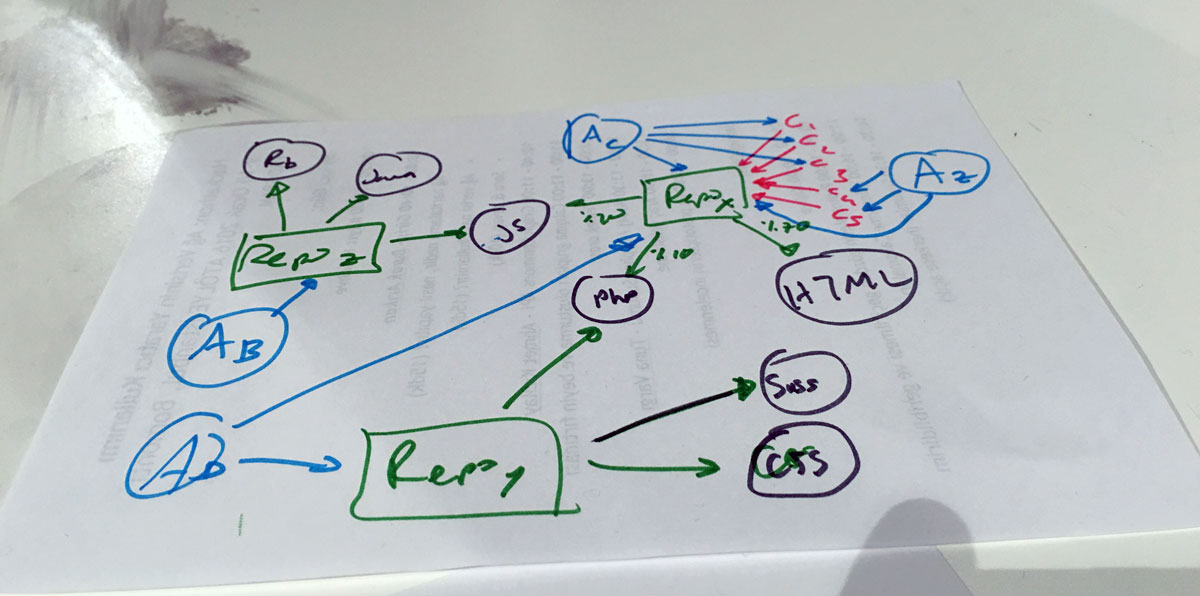
Githubbers is a network map of code repositories on Github connected via shared contributors and programming languages used in the projects. Created by Kerem Gunes, the Githubbers graph counts the number of commits by each contributor and the percentage of programming languages used in the project, which are then used as weights of the connections. In the graph, the red nodes are repositories, the blue nodes are programming languages, and the black nodes are contributors. Using the graph filtering feature, you can focus your view to observe only the stronger contributors and language connections.
This graph is generated by the Githubbers application which collects data via Github API and generates graphs using the Graph Commons API.
- Data source: Github API
- Code repository: https://github.com/k-gun/githubbers
- Graph generator: PHP7 Wrapper for Graph Commons API
Mapping Turkey-Russia Commercial Relationships
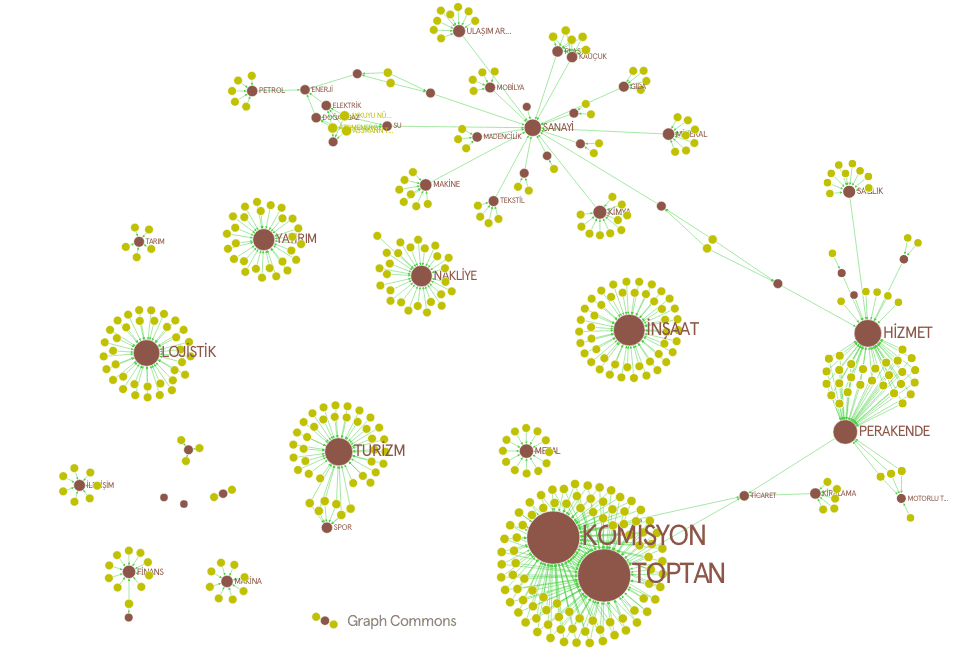
This graph contains the companies registered in Turkey trading goods with Russia. Created by Koray Taylan, it presents the potential damage on certain sectors due to the conflict between Russia and Turkey.
- Data source: kap.gov.tr (public companies listed in the stock exchange)
- Graph generator: Node.js Wrapper for Graph Commons API
Graph of electric vehicles
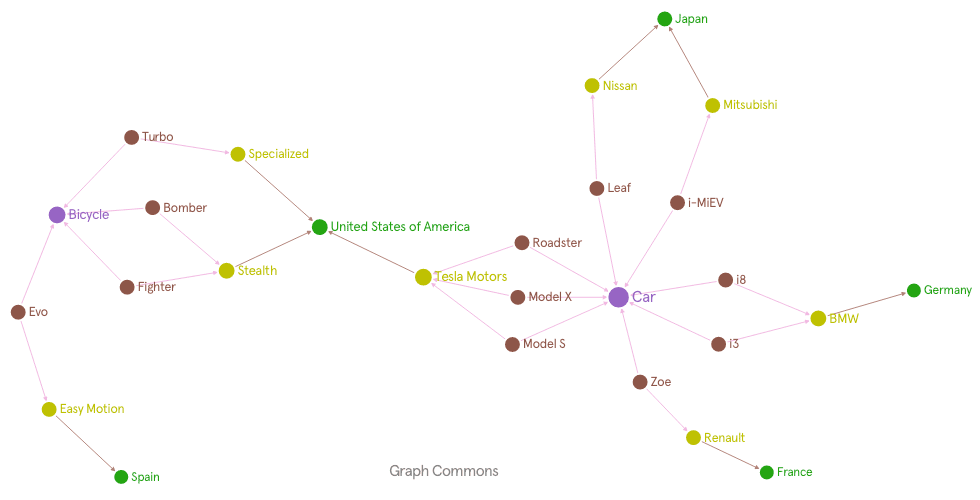
This graph sketch, also created by Koray Taylan, shows which car brand produces which new electric car model. It could be improved by adding common properties of these electric car models. Do they have auto parking capability? Do they have auto-pilot capability? Are they part of a charging station network? etc.
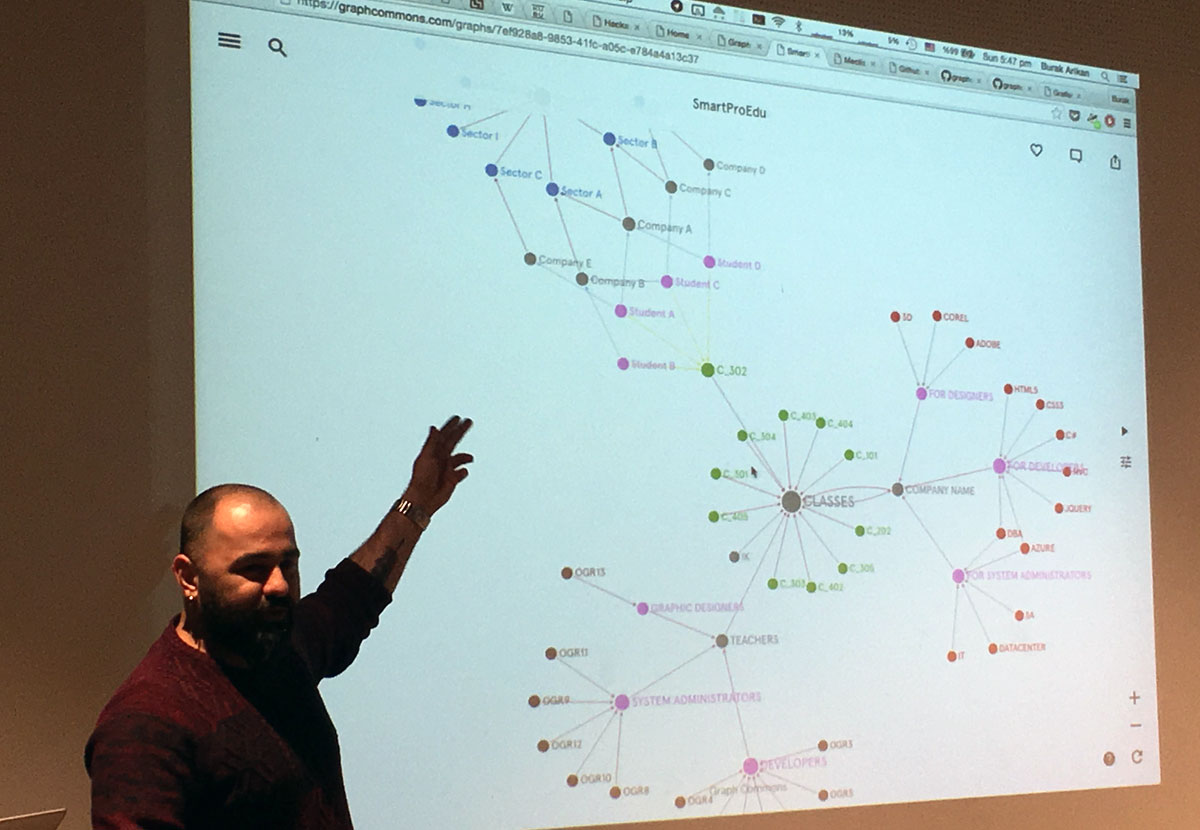
SmartPro academy structure graph
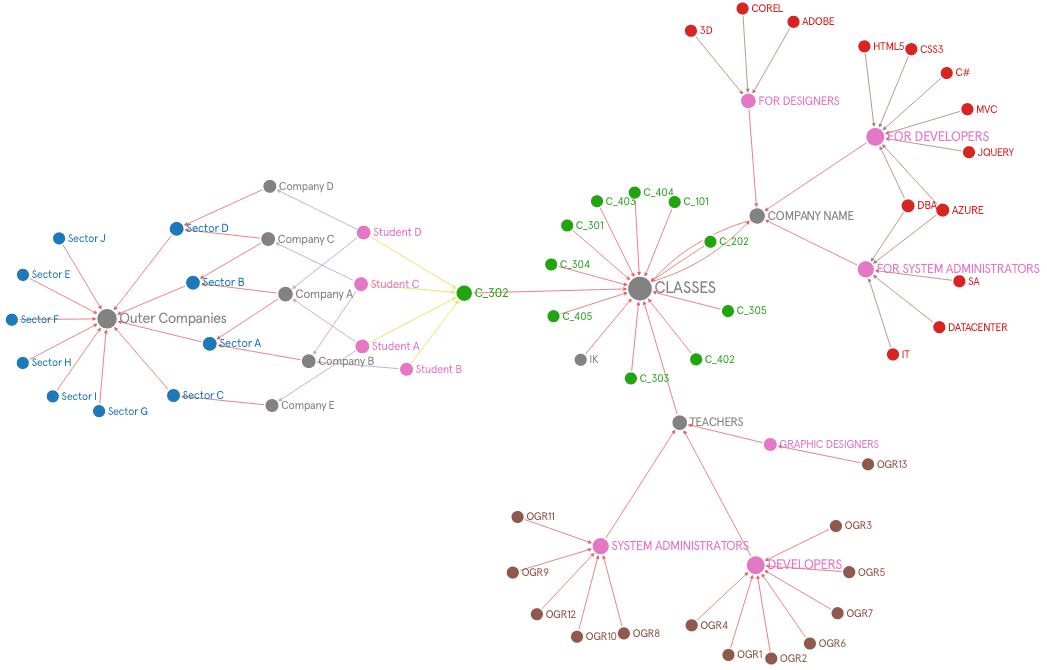
Network map of the organizational structure of SmartPro Academy. This graph shows how courses are organized around tutors and topics as well as the hiring companies who partners with the academy.
Digital cultural ecologies in urban settings
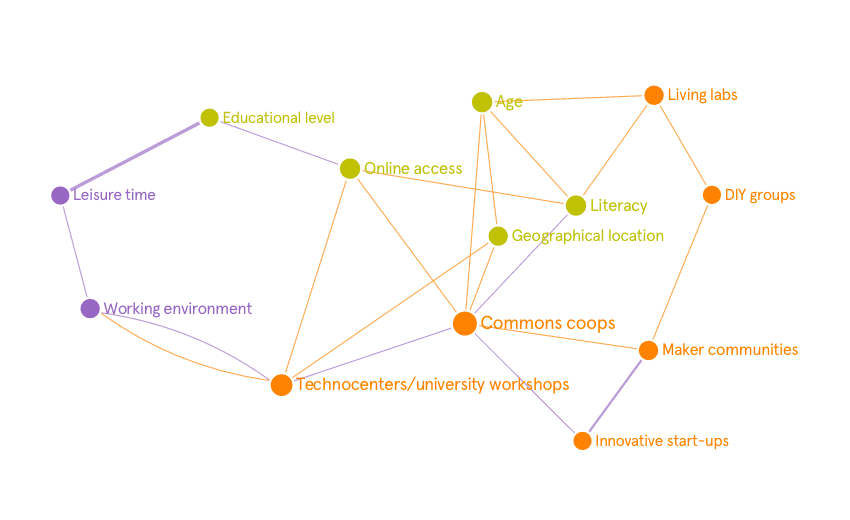
Initiated by Asli Telli Aydemir, this graph attempts generate a workable taxonomy of digital culture assets for medium-sized cities in Turkey.
3D graph viewer
An OpenFrameWorks graph viewer, developed by Serkan Sokmen, renders any graph from Graph Commons as a 3D network visualization. As you may know, “Can you make it 3D?” is one of the first reactions given for a graph, but it is not preferred for network mapping, because 3D camera view prevents clear comparison of the sizes of the nodes that are in the back vs at the front. However, first-person shooter camera gaze is great for navigation, flying through a three dimensional network space. Also for the 3D graph visualizations, instead of relying on radius for representing important nodes, it is recommended to use a metaphor of star constellations, that is to say use internal illumination of node spheres to represent degree centrality.
Mapping Slack chat conversations
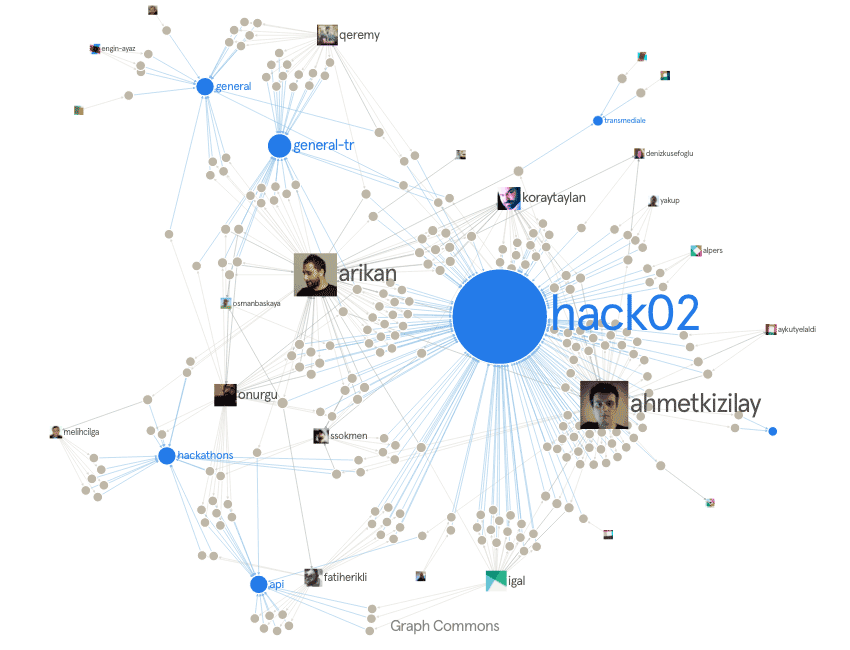
Graph Commons Slack Activity is the network map of our community’s public conversations on Slack generated by @graphbot, which is a project we undertook at Graph Commons. When you add @graphbot to your team, it maps who mentions whom, and who is active in which channel in your Slack team. A question like “@graphbot what is your graph url?” returns the expected url. Also, you can ask who mentioned you recently. One of the best part is, you can directly ask @graphbot “suggest a channel for me”, and it will give you a list of channels that you might want to join, using the network intelligence directly from its graph. We’d say @graphbot is quite effective for making sense of large community activity using Slack in their collaborations.
Using @graphbot in your Slack team is pretty straightforward, follow the step by step instructions at the @graphbot repository.
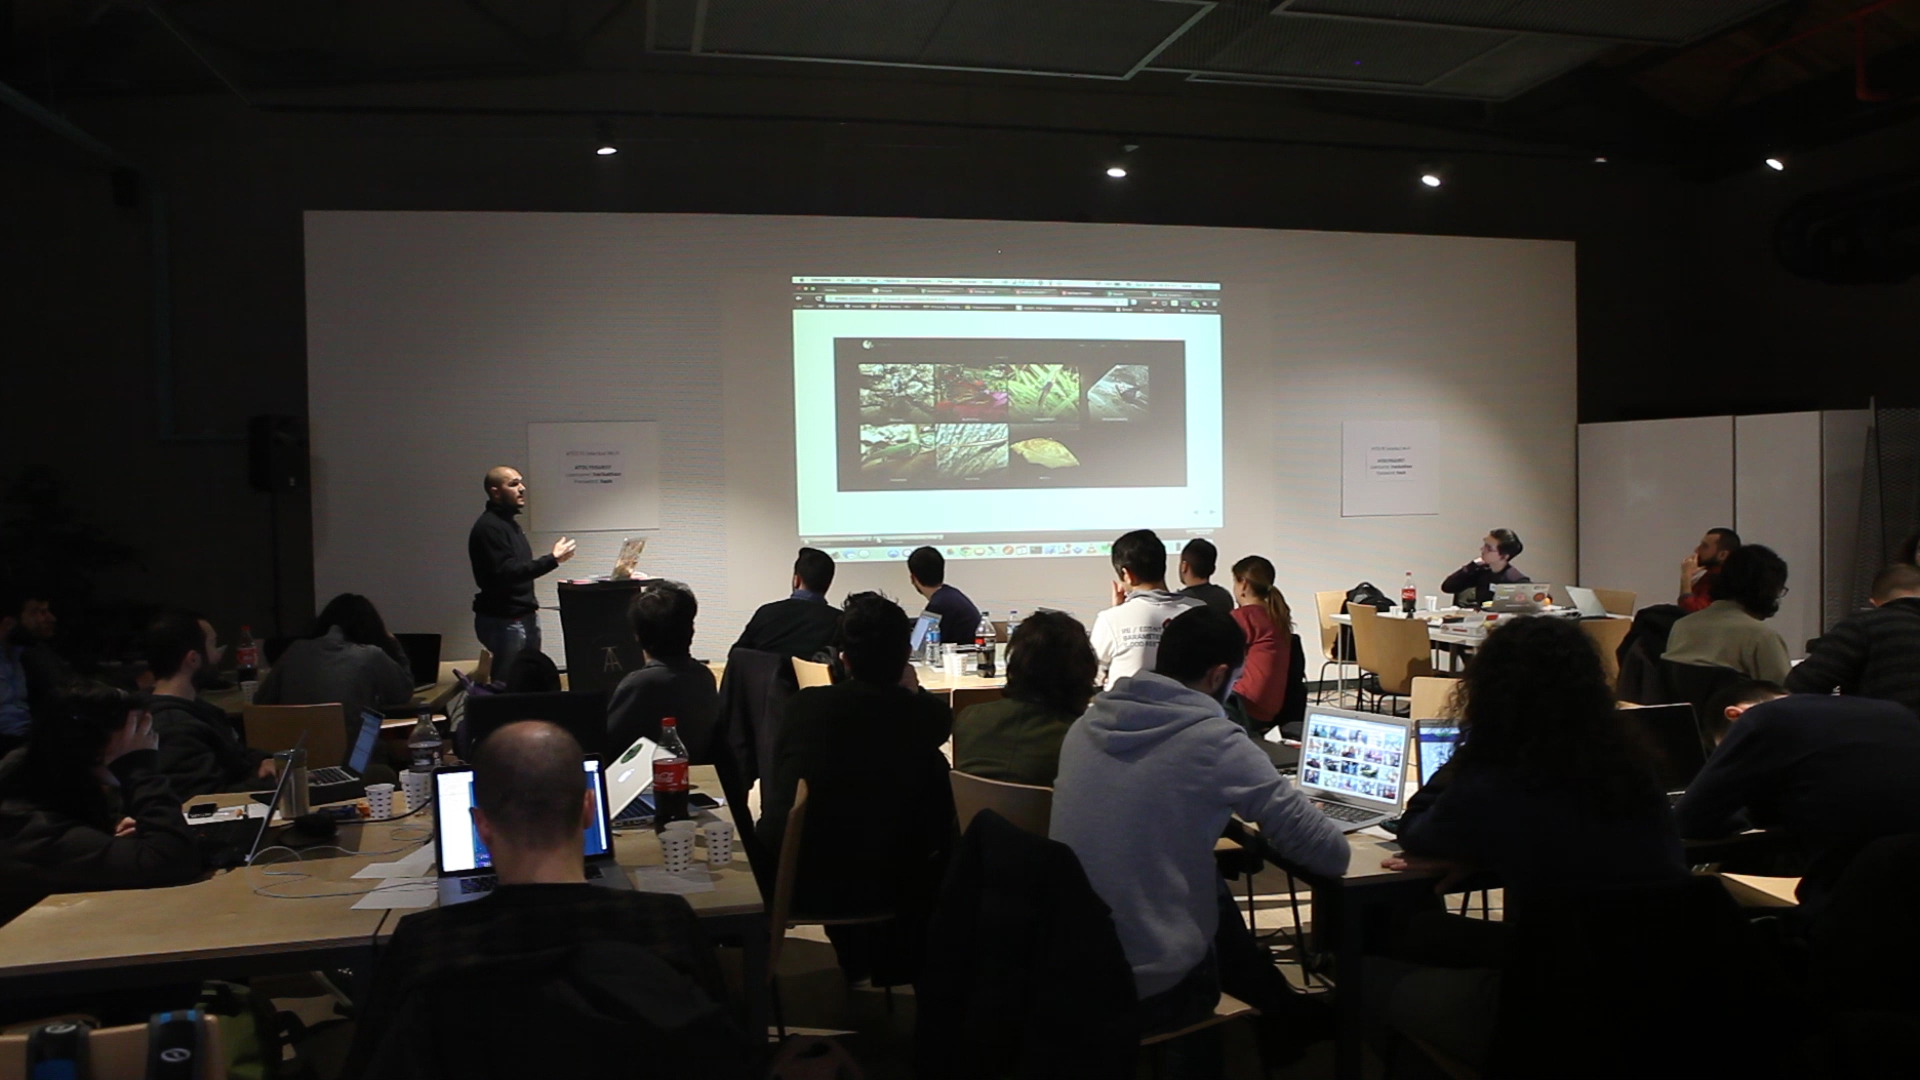
Presentations
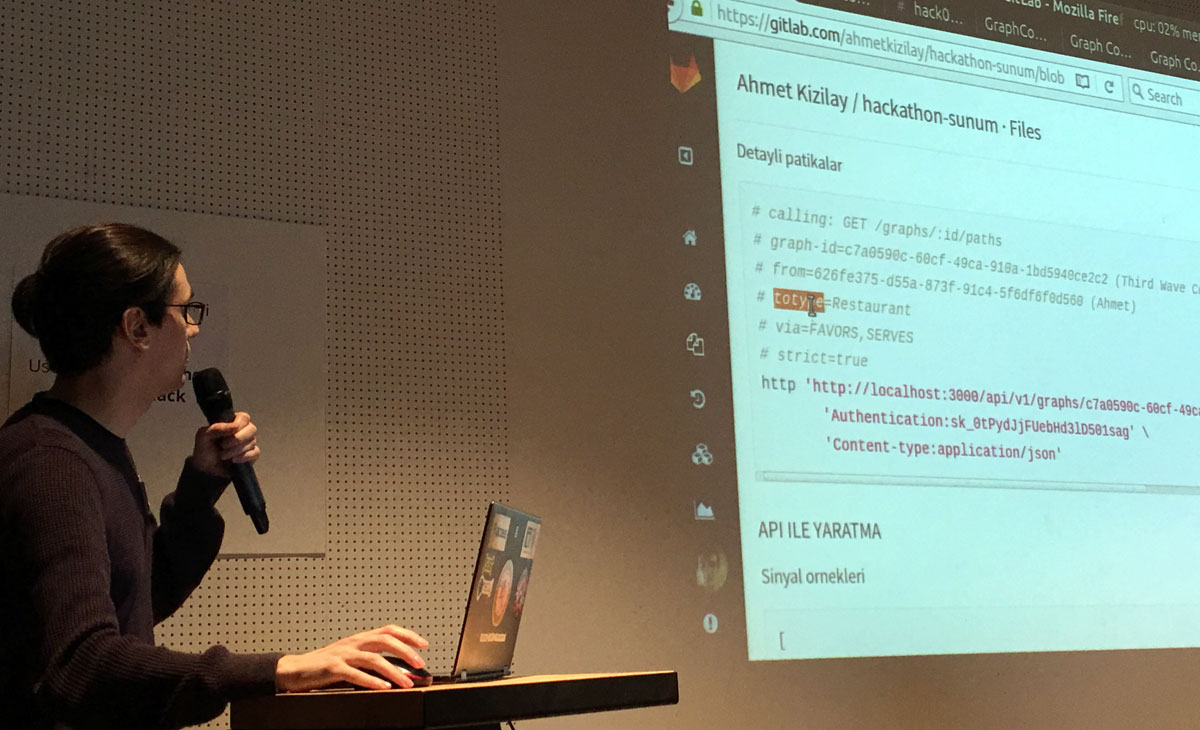
How to use Graph Commons API – Ahmet Kızılay presents the Graph Commons API structure, read/write end points, how to programmatically navigate a graph, search, and make intelligent path calls, as well as signaling queries for adding/updating/deleting nodes and edges in a graph.
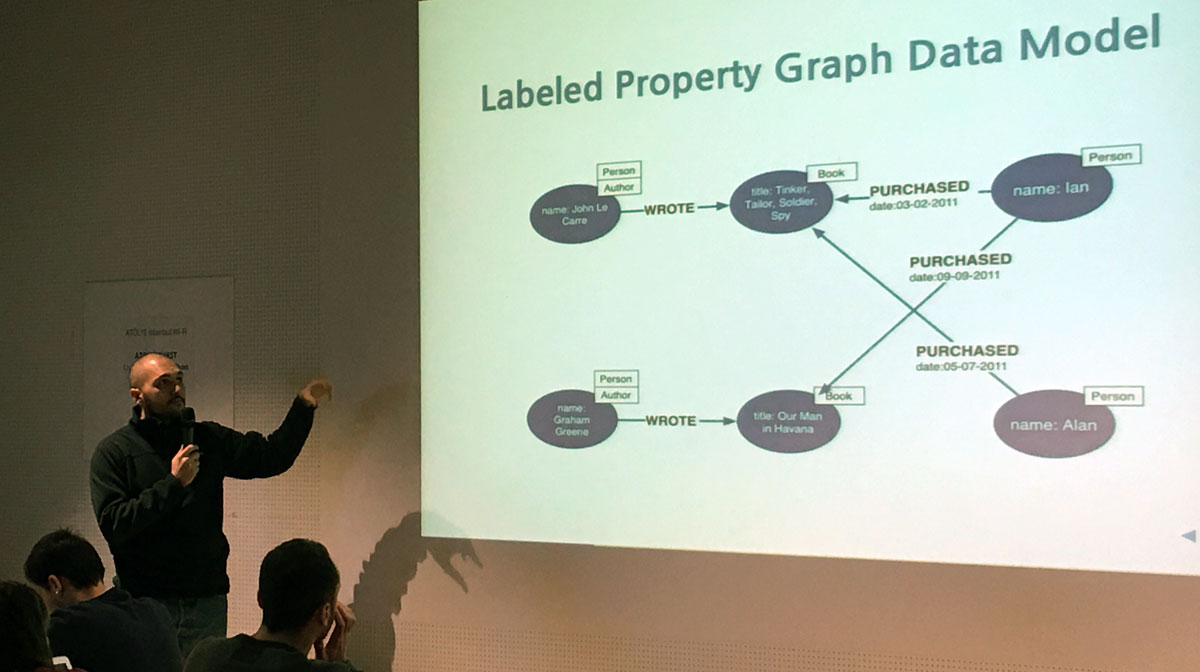
Neo4j Essentials – Tuna Vargı presents how graph databases are different than SQL table databases, an introduction to Neo4j, and a step by step usage of Cypher graph query syntax.
Also see:
Düğümküme: A presentation on graph databases (in Turkish) by Fatih Erikli
Graph Commons API Wrappers
-
Ruby Wrapper initiated by Yakup Cetinkaya
-
Python Wrapper initiated by Fatih Erikli
-
Node.js Wrapper initiated by Igal Nassima
-
PHP7 Wrapper and PHP Wrapper initiated by Kerem Güneş
View the Graph Commons API Documentation for other Libraries & Examples.
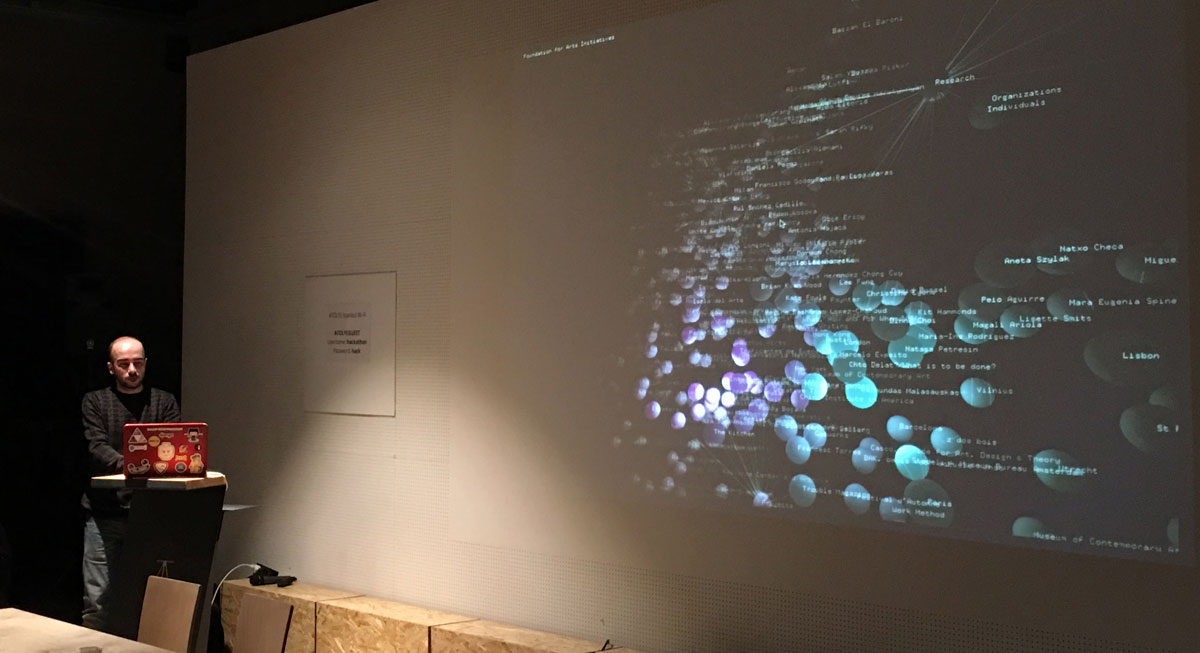
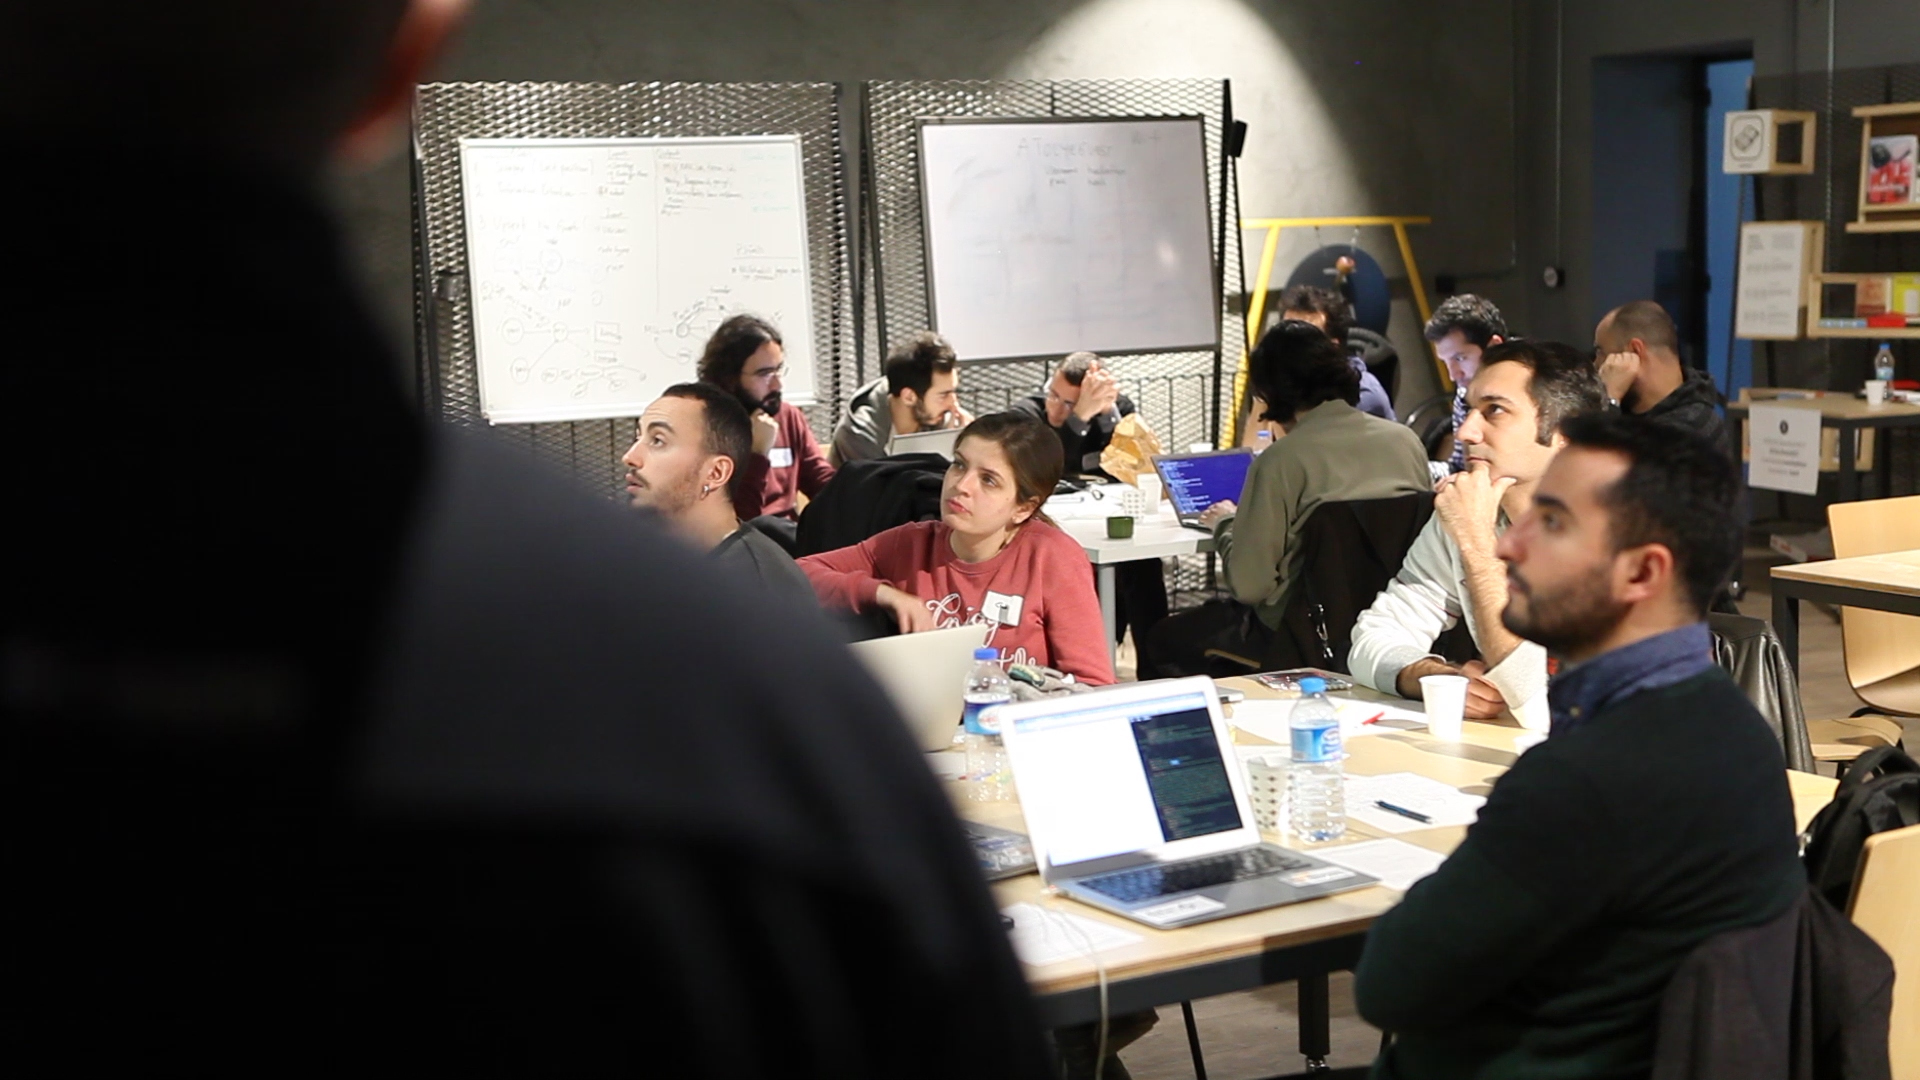
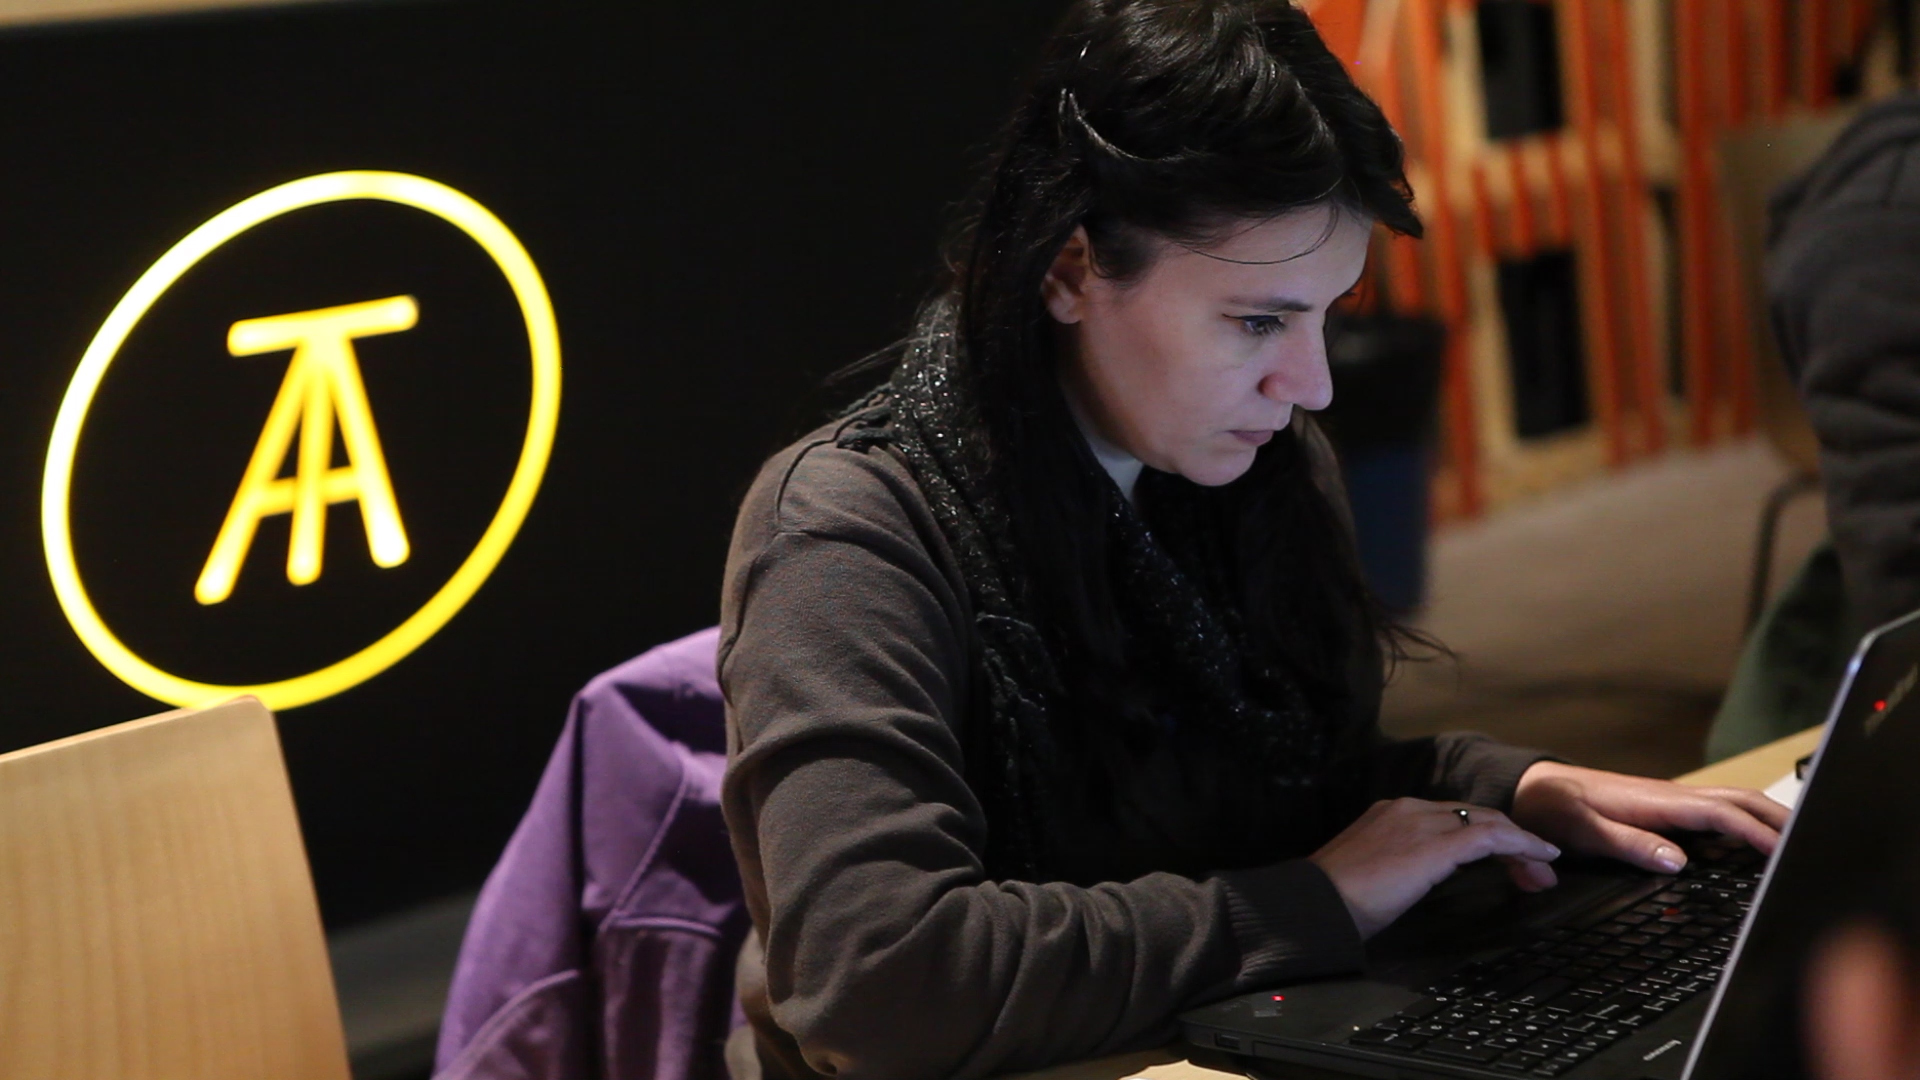
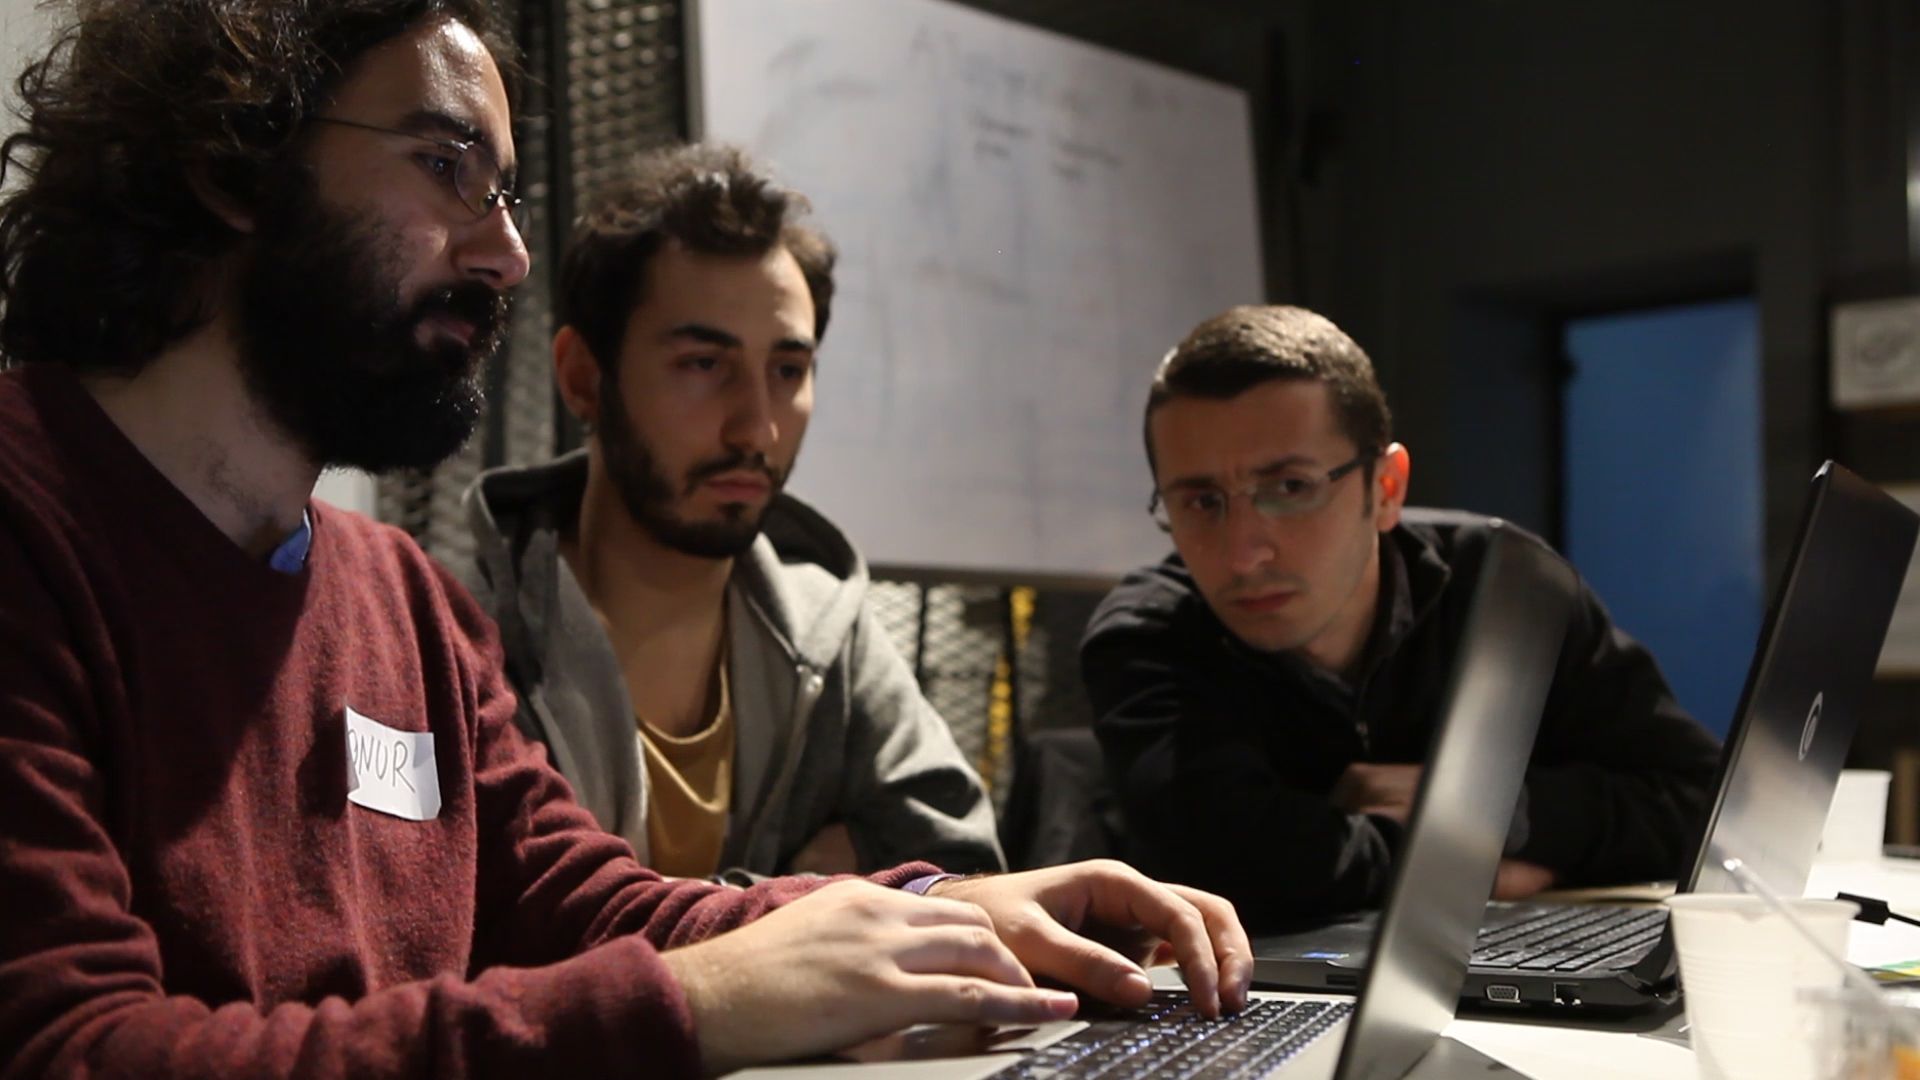
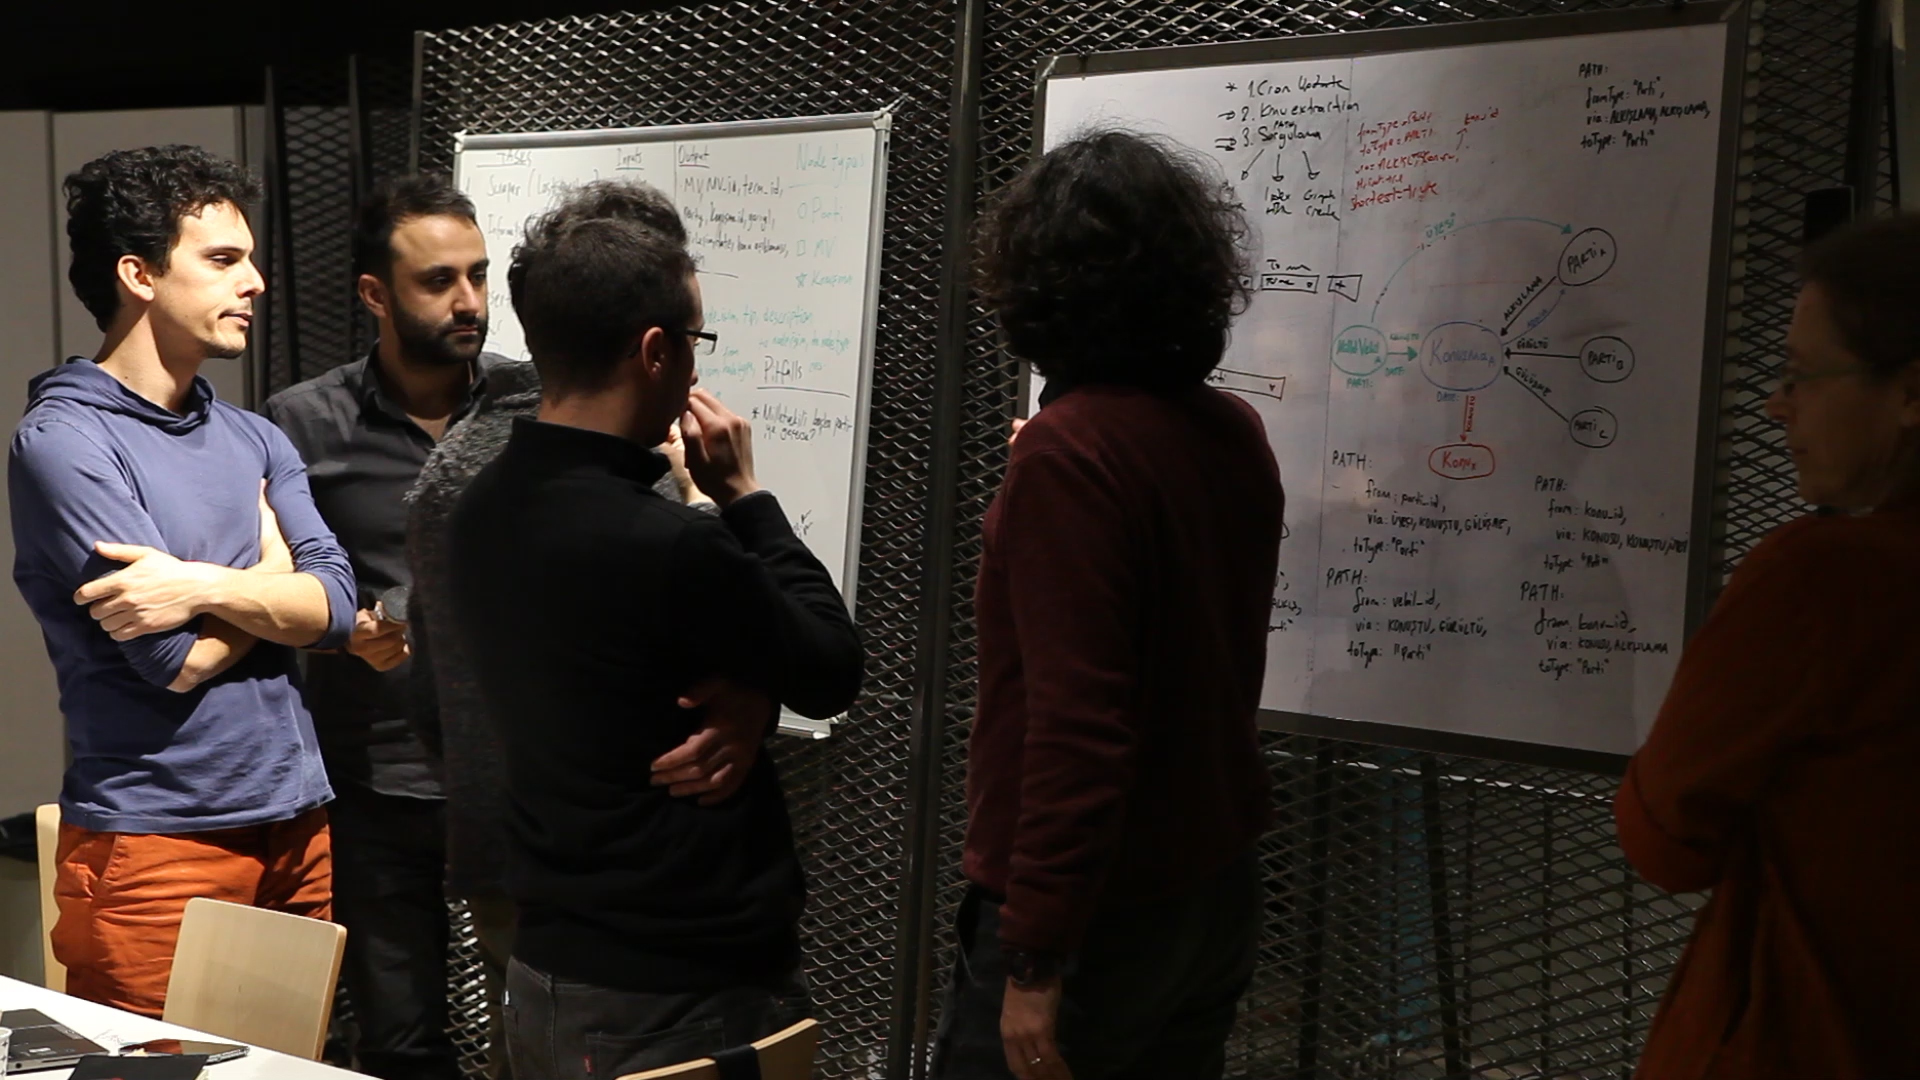
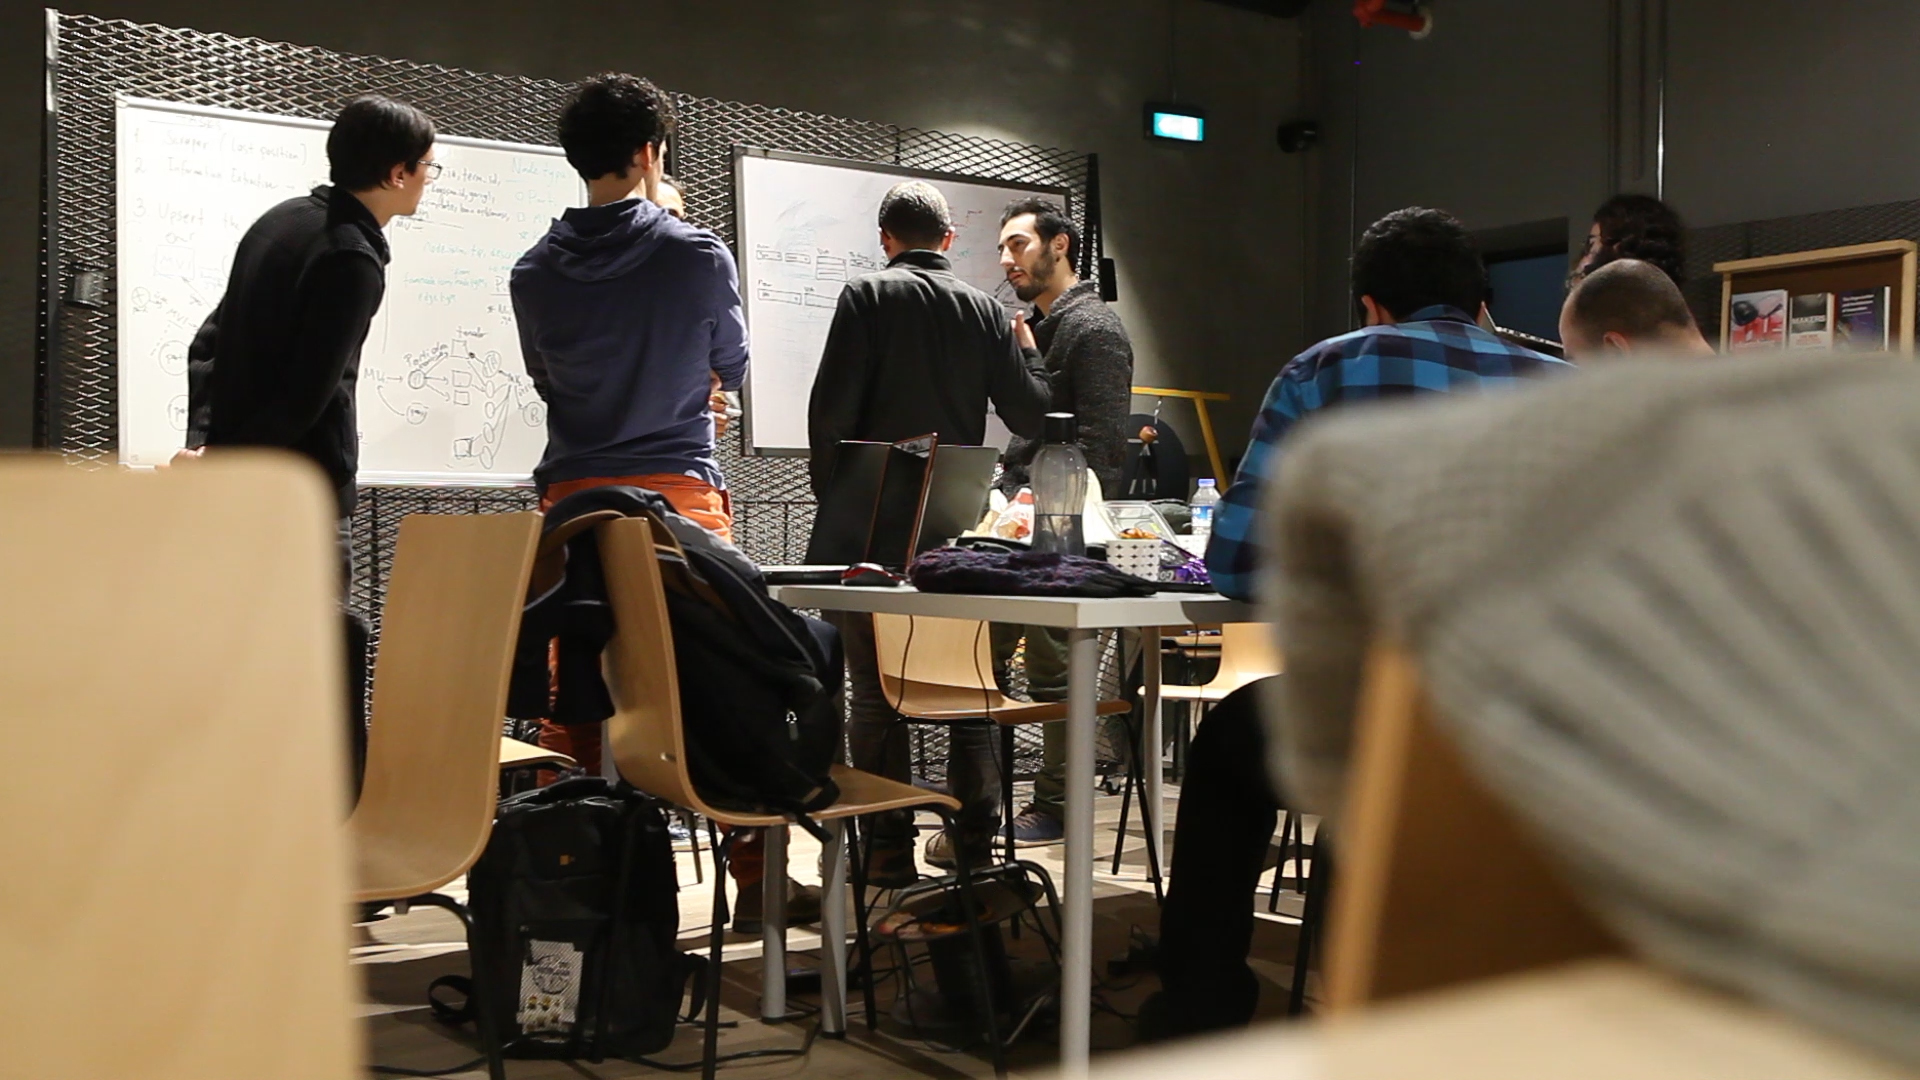
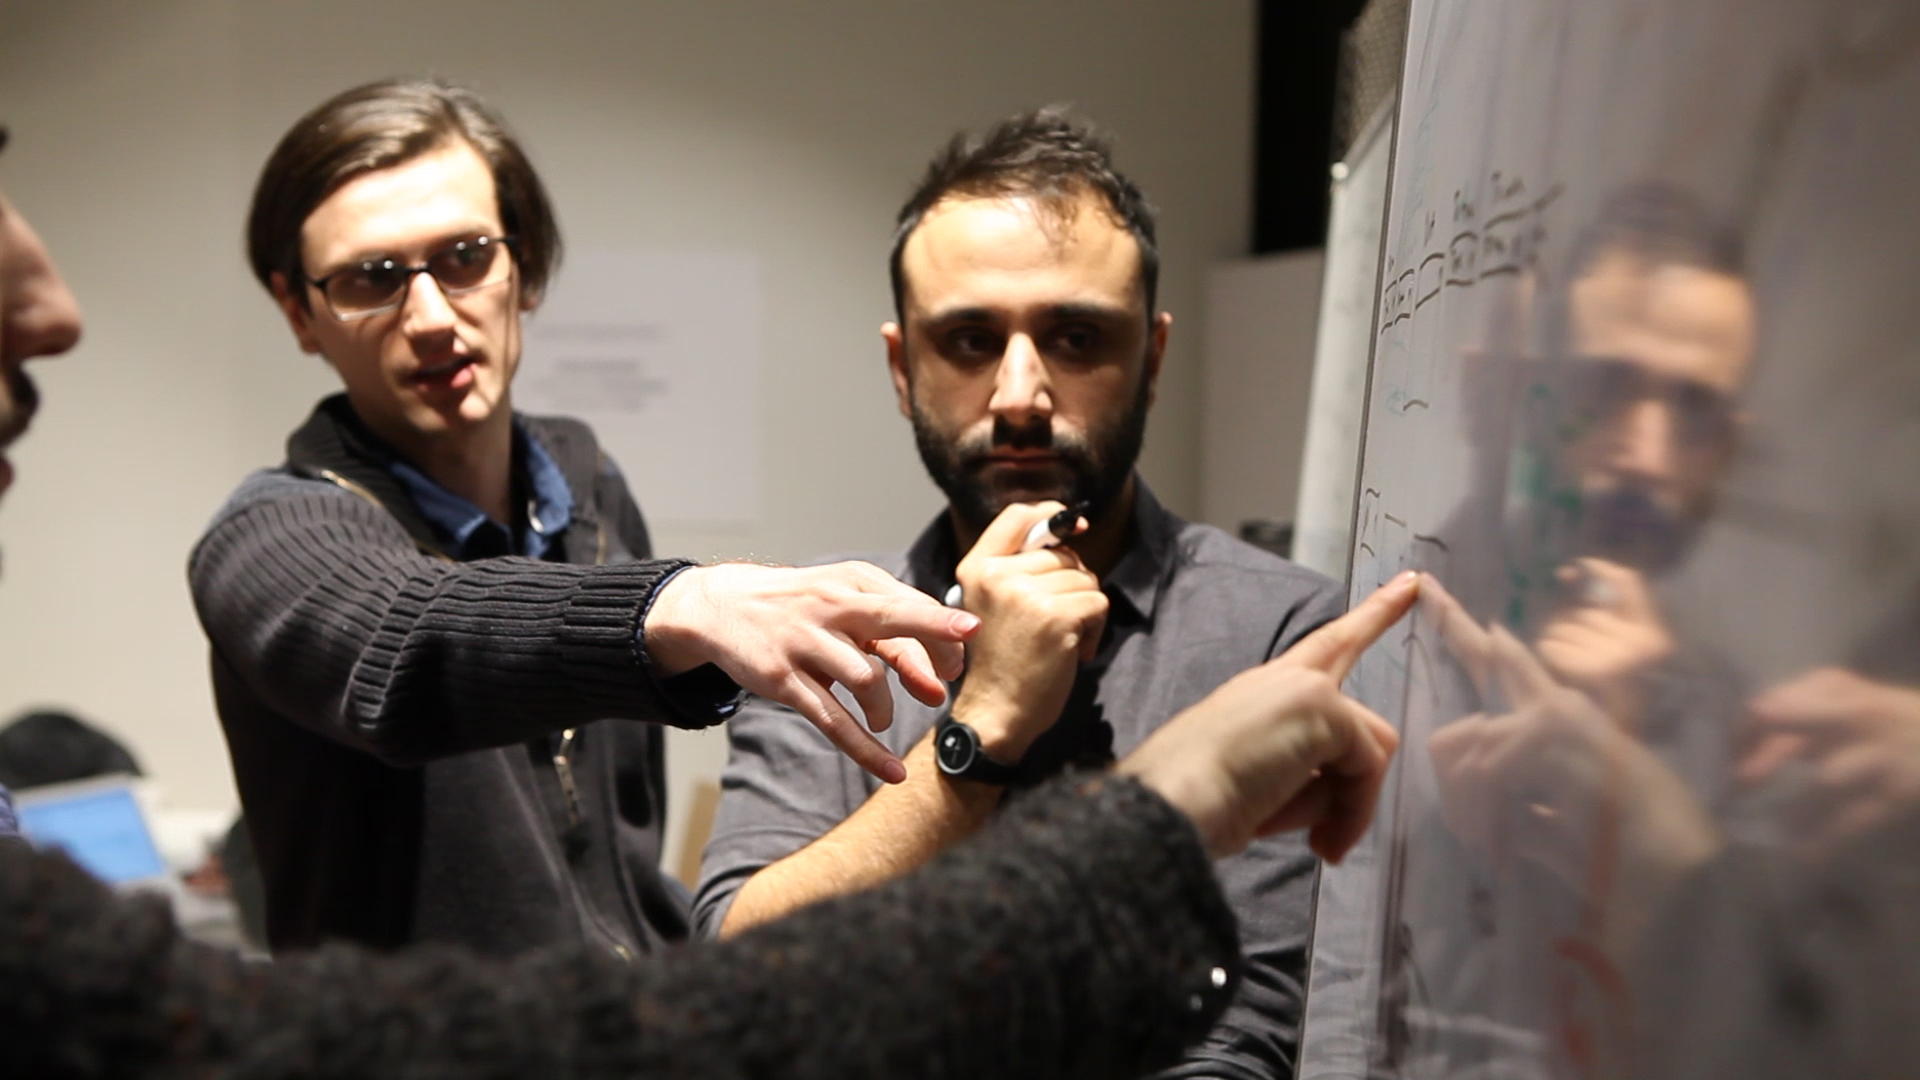
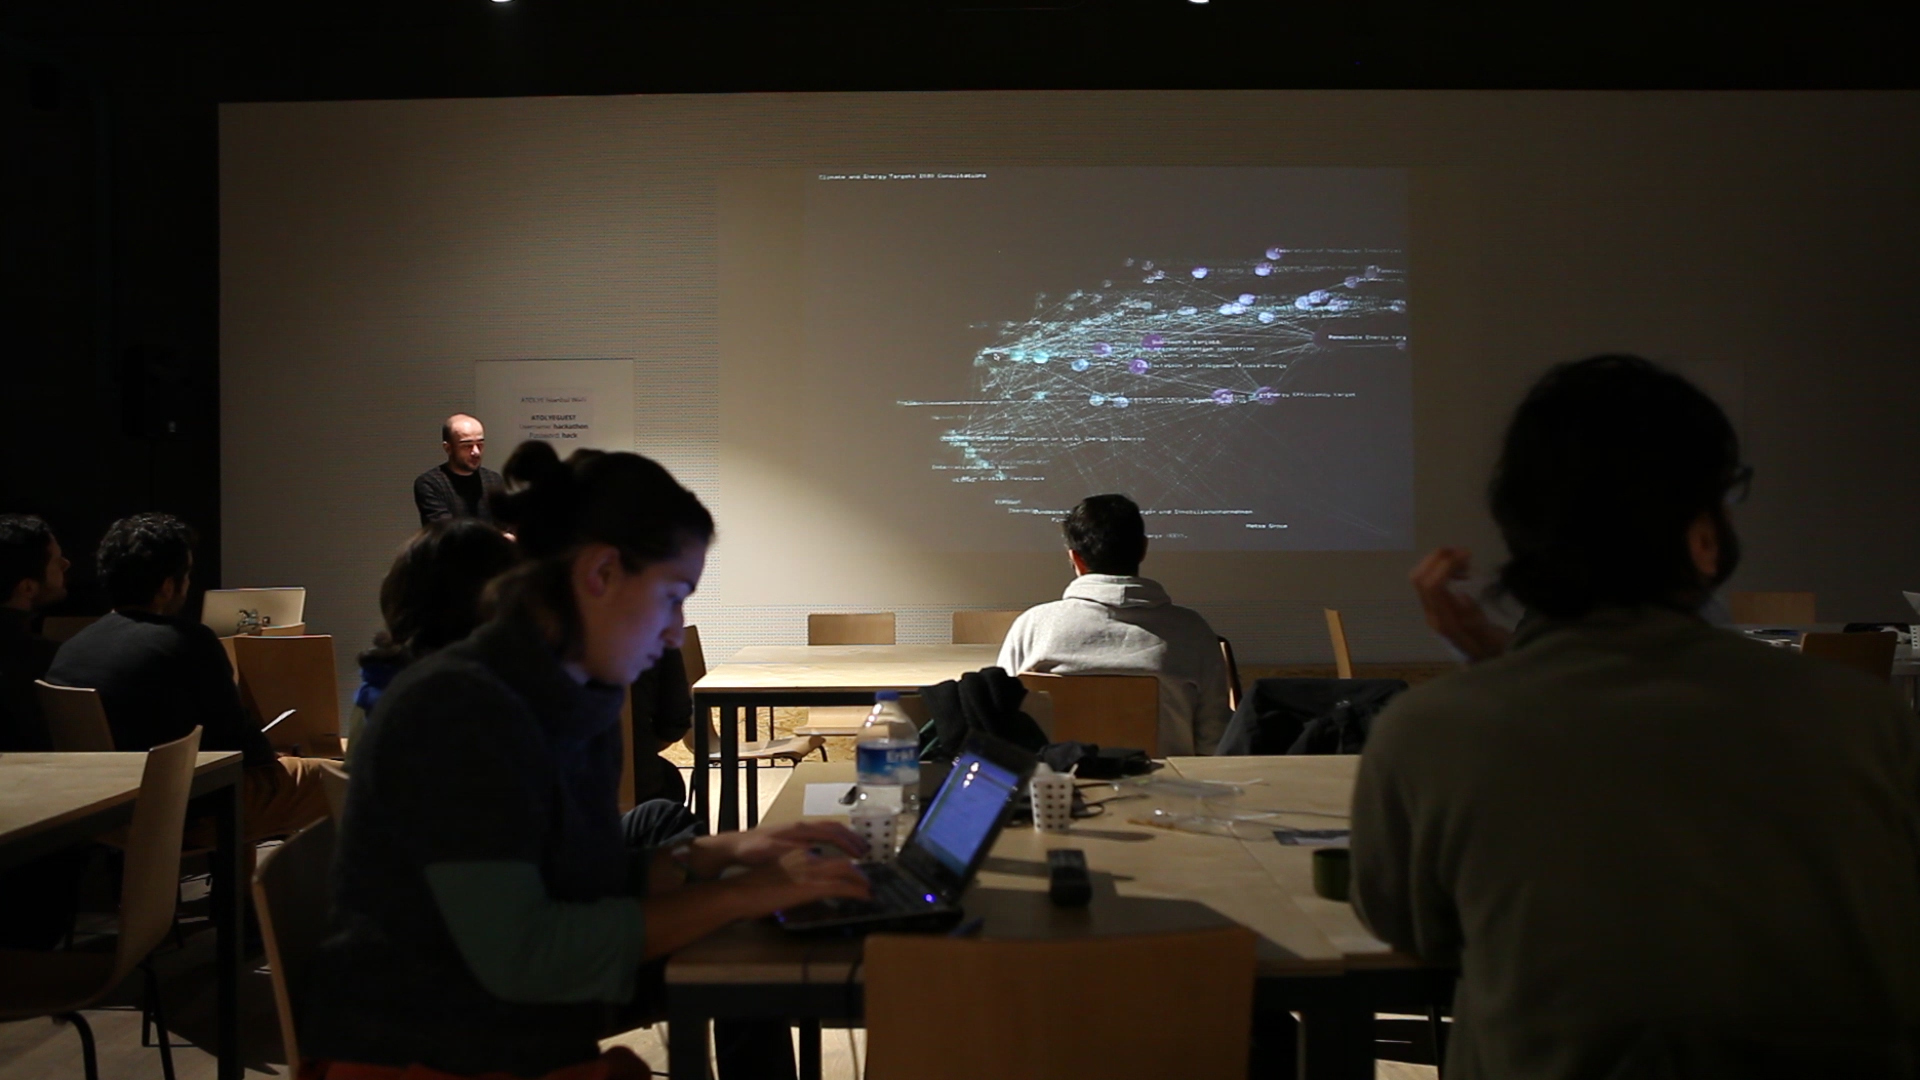
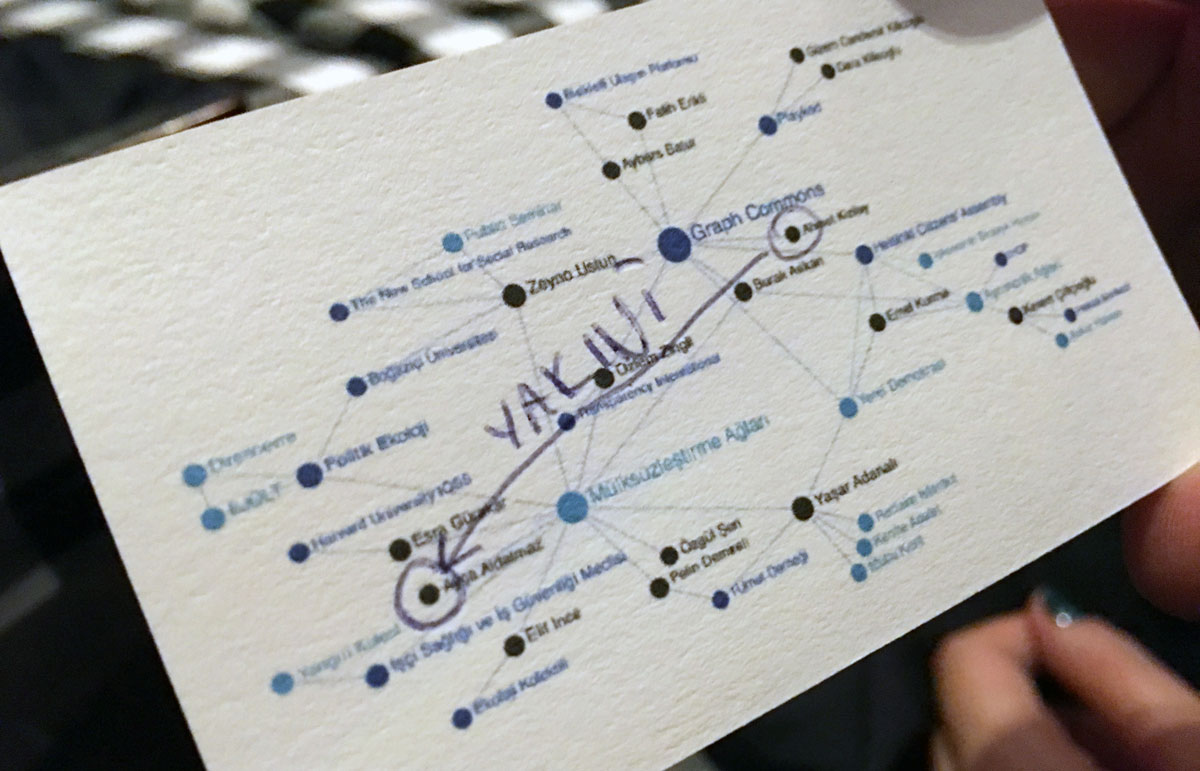
Moments from the hackathon
For questions and comments on the tools or graphs, contact the respective participants. For the Hackathon questions and comments in general contact us at the Graph Commons Contact page.
This event could not be possible without Ayça Aldatmaz and Ahmet Kızılay’s hard labor, our host ATOLYE Istanbul, and an insightful presentation by Tuna Vargi. We thank you all!