We build our networks!
Hackathon September 12-13 2015
TMMOB Chamber of Architects, Karaköy, Istanbul
PARTICIPATE PROGRAM TOPICS, MENTORS, RESOURCES CONTACT
Journalists and civil society organizations publish their research results as plain text in an article or report, and often without the research data itself. News articles, press statements and reports are produced as raw texts and a short while after the publication date, these texts lose their relevance and thus their significance. Likewise, reusing these texts is rarely the case.
Yet, such texts contain highly valuable embedded information, which, in fact, can be fragmented and structured into meaningful pieces of data and become reusable. Then, information can be used with variety of new contexts, and can be transformed into a constantly growing resource of references. One of the ways of working in this form, requires a practice of relational or network mapping.
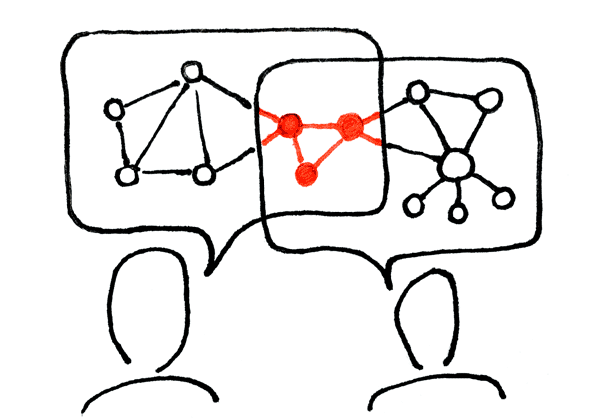
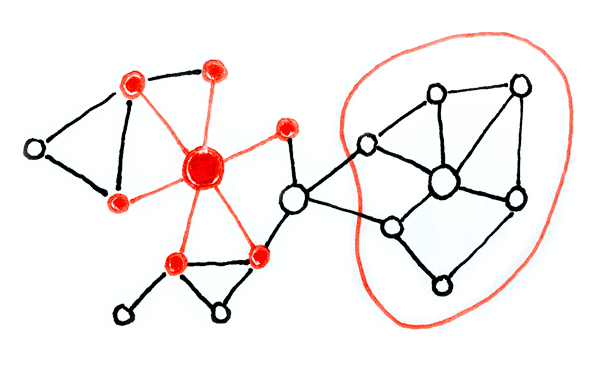
Network maps offer us a “common language”, that is both visual and mathematical. We can use it to study systems that may differ in their nature, appearance, or scope. For example, the actors and relationships in a news article or a report could be mapped as a network diagram. Then such a diagram can be fed into a software which could make an analysis to reveal central actors, indirect connections, organic clusters and bridges that are otherwise hidden in the data. Thus, as we turn our network maps into a graph database, we can always query actors, browse their relations, make comparisons and discover interesting relations within our work.
Structured journalism and data journalism, despite their likeness, are fundamentally different from one another. Data journalism aims to create stories from data via visualization techniques, whereas structured journalism aims to transform the plain text into structured data in order to make it reusable.
Structured Journalism and Network Mapping Hackathon likewise aims to model semantic networks on topics in the field of journalism and civil society, compile relatively big data from available sources into graph databases, and generate network maps. Code savvy participants will work in the guidance of mentors for modeling, and they will improve their understanding of complex networks and network analysis as well as develop tools that can be utilized by everybody.
The hackathon has four parts:
1. Network Modeling
Expertise of mentors will meet with technical knowledge of the participants during the data modeling process. This part consists of using pen and paper and identifying main actors and critical material relations within the field in a collective brainstorm. Urgent questions and how to answer them will be discussed and designed.
2. Development of tools
On the basis of colelctive modeling done in the previous stage, data compilation tools will be developed. Participants will work on either publication platforms or data mining tools that will programtically generate graph data according to the needs. First prototypes of the tools are planned to be finalized in the first day of the workshop and be polished in the second day of the hackathon. This way we will also find some time to debate what the beta versions should be like, how to improve and further develop these tools.
3. Mapping
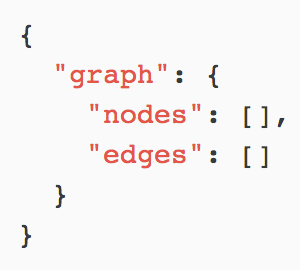
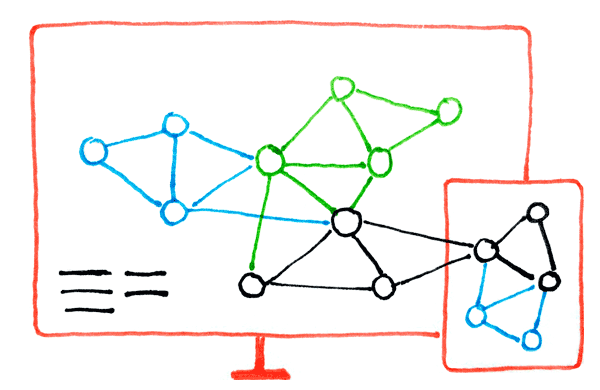
The compiled data will be imported to the Graph Commons platform and will be made into interactive network maps, which will be reviewed, read and analyzed, and published on the platform.
4. Presentations
At the end of the second day, all participants’ work will be presented and debated publicly. The data models of the work, it’s visual language, and the compilation tools will be evaluated and discussed.
Participation
The workshop will be in Turkish, please go to the Turkish Hackathon page for qualifications, the application form, and other resources.
Program
First Day (Sep 12 Saturday)
09:30 - 10:00 Registration & Coffee
10:00 - 10:45 Kickoff
- What is structured journalism? (10min)
- How to make network maps? (15min)
- How to read and analyze network maps? (10min)
- Q&A (10min)
11:00 - 12:00 Topics, mentors and forming groups
12:00 - 13:00 Break
13:30 - 18:00 Work
- Brain storming and network modeling with mentors (1 hr)
- Tool Development and Mapping (4 hrs)
18:00 - 19:00 First Prototypes Review
Second Day (Sep 13 Sunday)
09:30 - 10:00 Coffee
10:00 - 11:00 Prototypes Review
11:00 - 16:00 Project Refinements
17:00 - 19:00 Public Presentations
Topics, Mentors, Data Sources
Mentors are invited to advise and participate in the modeling of networks on their respective topics. They will point to important types of actors in the field, which of their properties is interesting, and the critical relationships between the actor types.
Data sources could be plain text (news article, report etc.), semi-structured document (HTML table, wiki pages etc.), or full structured data source (APIs, databases etc.). While web scraping could be used for plain and semi-structured content, APIs and databases will be programmatically queried.
Please recommend data sources to workshop@graphcommons.com
Ecology and Right to the City
Mentors
- Elif İnce, Gazeteci, Ekoloji Kolektifi
- Yaşar Adanalı, Mutlu Kent
- Bengi Akbulut, Ekoloji Kolektifi
- İmre Azem, Film direktörü
Data Sources
- İMECE
- http://www.ekolojikolektifi.org
- https://mutlukent.wordpress.com
- http://www.kuzeyormanlari.org
- http://mulksuzlestirme.org
- http://www.direncevre.org
- http://www.karaatlas.org
- http://bianet.org/bianet/cevre
- http://bianet.org/bianet/kent
Internet Freedom
Mentors
- Aslı Telli Aydemir, Alternatif Bilişim Derneği, İstanbul Şehir Üniversitesi
- Işık Mater, Alternatif Bilişim Derneği
- Ahmet Sabancı, Alternatif Bilişim Derneği, Jiyan
Data Sources
- https://alternatifbilisim.org
- Internet Ungovernance Forum
- http://privacy.cyber-rights.org.tr
- http://engelliweb.com
- Bianet İfade Özgürlüğü Kategorisi
- Article19
- Access
- Chaos Computing Club
- Çağdaş Gazeteciler Derneği
- Index on censorship
- Sınır Tanımıyan Gazeteciler
- EDRI
- Global Voices
Open Government and Laws
Mentors
- Özlem Zıngıl, Şeffaflık Derneği
- Esra Gürakar, Okan Üniversitesi
Data Sources
Regional Public Policies and Investments
Mentors
- Emel Kurma, Helsinki Yurttaşlar Derneği
Data Sources
Monopoly, Corruption, Transparency
Mentors
- Orhan Silier
- Özlem Zıngıl, Şeffaflık Derneği
- Esra Gürakar, Okan Üniversitesi
- Mustafa Sönmez, Birgün
Data Sources
Media Ownership
Mentors
- Ceren Sözeri, Galatasaray Üniversitesi
- Murat İnceoglu, Gazeteci
Data Sources
- Türkiye Medya Sahipleri Ağı
- Bianet medya kategorisi
- Türkiye’de medya sahipliği 2015
- Türkiye’de Medya-İktidar İlişkileri Raporu, 2015
- RTÜK
- RATEM Sektör Raporu, 2013
- Medya temsilcileri Darbeleri Araştırma Komisyonu’na ne anlattı?
Labor: working conditions, struggles, and resistance
Mentors
- Aslı Odman, Mimar Sinan Üniversitesi, İşçi Sağlığı ve İş Güvenliği Meclisi
- İrfan Kaygısız, Birleşik-Metal Union
- Ebru Işıklı, Emek Çalışmaları Topluluğu
- Orhun Aras Köksal
Data Sources
Woman Rights
Mentors
- İdil Elveriş, İstanbul Bilgi Üniversitesi
- Çiçek Tahaoğlu, Bianet
- Burcu Karakaş, Gazeteci
Data Sources
- http://www.anitsayac.com
- Twitter’da #sendeanlat
- https://bianet.org/konu/cetele
- http://www.cinsomedya.org
- http://www.5harfliler.com
- Bianet Kadın Kategorisi
LGBTI Rights
Mentors
- Çiçek Tahaoğlu, Bianet
- Burcu Karakaş, Gazeteci
Data Sources
Education Reform
Mentors
- Batuhan Aydagül, Eğitim Reformu Girişimi
Data Sources
Immigrant Rights
Mentors
- Özge Aktaş Mazman, TESEV
Data Sources
- http://gocmendayanisma.org
- http://www.multeci.net
- http://www.themigrantsfiles.com
- Avrupa ve Çevresi Göçmen Kampı Haritaları, 2005-2009, Migreurop
- Migreurop Network
- Türkiye iç göç akımlarının güncel verisi ve göçmenlerin yaş ve eğitim profilleri
- Suriyeli göçmenler ile ilgili güncel veriler Buradan indirilebilecek stratejik dokumandan faydalanılabilir.
- Suriyeli göçmenler ile ilgili insani yardım ve araştırma için hangi ülke ve hangi kurum ne kadar fon veriyor Bu dökümanlar Orta Doğu’daki diğer ülkelerin de dahil olduğu bir harita üzerine akan fonları gösterebilir.
- Afad 2013 tarihli Suriyeliler saha raporları ve Suriyeli kadınlar ile ilgili 2014 tarihli raporu
- Uluslarlararasi göç örgütü Türkiye sayfası Genel olarak Türkiye göçmen verileri.
- Suriyeliler ile ilgili araştırma yapmış Türkiye’deki STK’lar ve ne konuda araştırma yaptıkları
Militarizm
Mentors
- Kerem Çiftçioğlu, Hakikat Adalet Hafıza
Data Sources
- http://www.askerhaklari.com
- http://www.zorlakaybetmeler.org
- http://hakikatadalethafiza.org
- Bianet militarizm tag
- Vicdani Ret Derneği
Sustainable Agriculture & Food
Mentors
- Defne Koryürek, Fikir Sahibi Damaklar
Data Sources
- Buğday Derneği
- Fikir Sahibi Damaklar
- Slow Food Hareketi
- Yeryüzü Derneği
- Gıda Güvenliği Hareketi
- Doğa Derneği
- Doğa Okulu
- Greenpeace Türkiye
- http://www.tusedad.org
- http://www.karasaban.net
- http://www.gdoyahayir.net
- http://www.suhakki.org
- Tohum Takas Ağı
- tarimdunyasi.net
- Heifer
- Grist
- Yeşil Gazete
- Yeşilist
General
Mentors
- Serdar Paktın, pakt semiotics & strategy
- Gökhan Biçici, TAREM, dokuz8Haber
Data Sources
- https://tr.wikipedia.org
- https://www.wikidata.org
- http://www.tuik.gov.tr
- Google APIs
- NYTimes Topics
- BBC News Labs
- Sunlight Foundation API
- Avrupa İnsan Hakları Mahkemesi Veritabanı
- http://data.worldbank.org
- List of news media APIs
Publication Platforms
- Wordpress Plugin Development
- Drupal API
- RSS Beslemeleri
- Jekyll
- Twitter API
- Facebook Social Graph API

License
All tools created in the workshop belongs to its creators and expected to be licensed under a free and open source software license. The network maps or graphs created on Graph Commons belongs to its authors and licensed with Creative Commons International 4.0.